

Why you should upgrade to JMeter 5.0
Apache JMeter 5.0 has been released last week with many enhancements and new features.
We’ll see in this blog what are the most notable features and the reasons why you should upgrade to version 5.0 ASAP.
You’ll be more productive
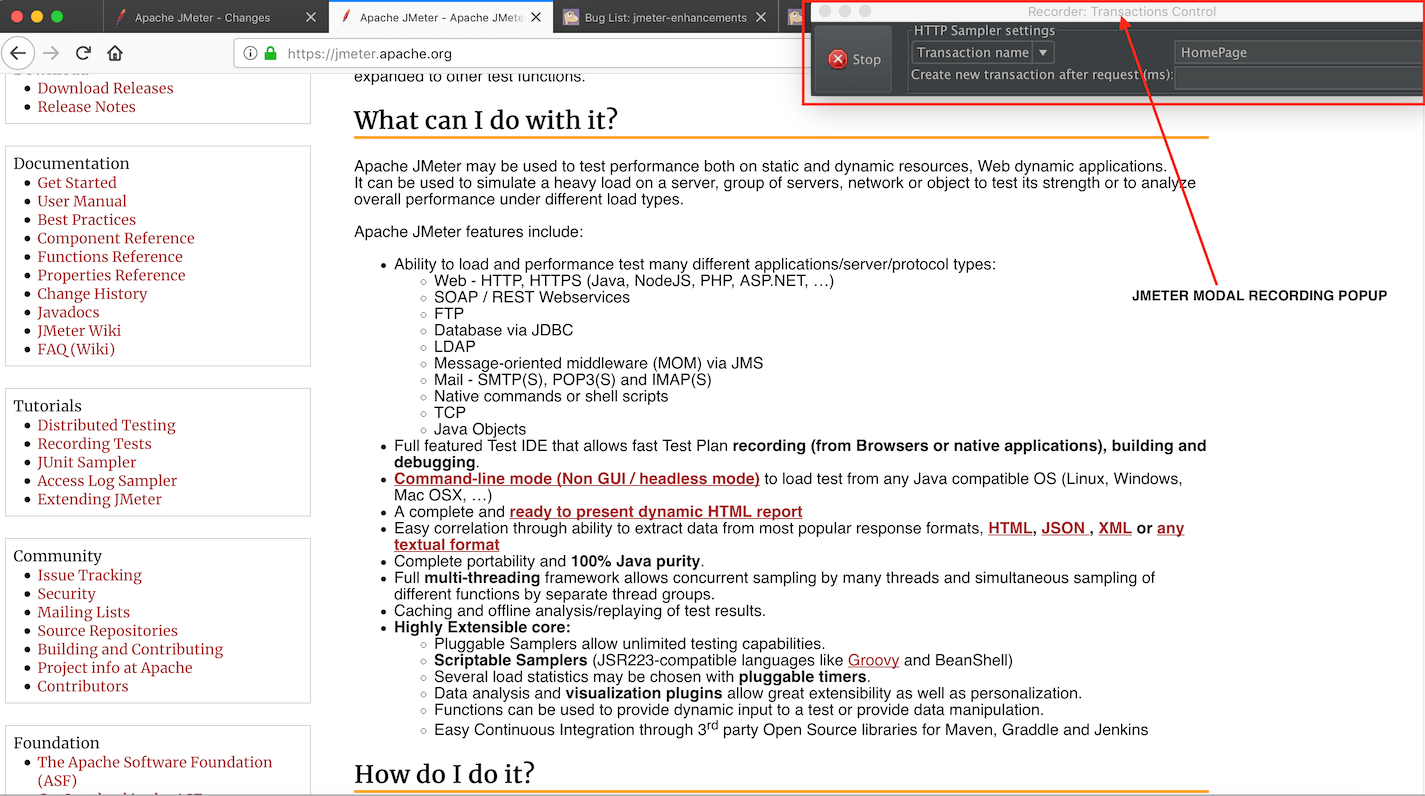
Recording your script in browser
Yes JMeter has a recorder since many versions.
With this version, an interesting enhancement was added to the script recorder.
It allows you to enter transaction names in a popup that stays above the browser.
You don’t need to switch between JMeter and the browser to name your clicks.
Working with REST and micro-services
- Rest Support has been improved allowing you to send JSON body with attachments. In the below example we send a PUT method with a JSON parameter “toto” with an attached file that we specify in “Files Upload” tab
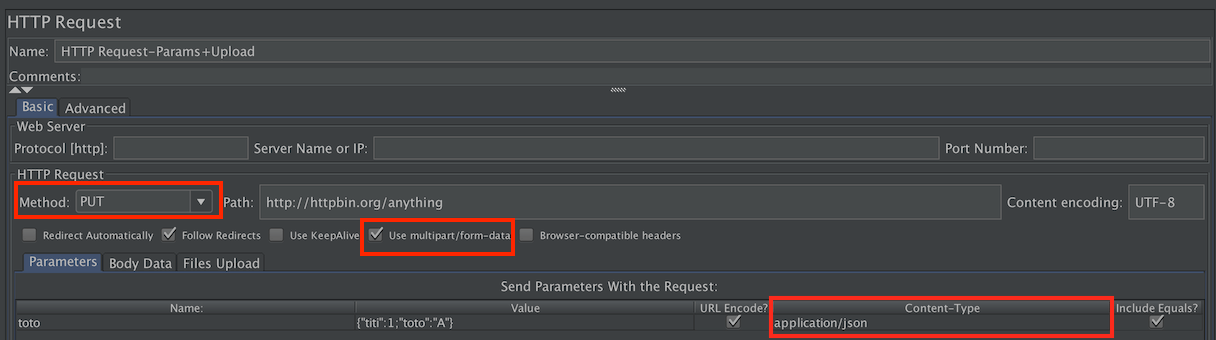
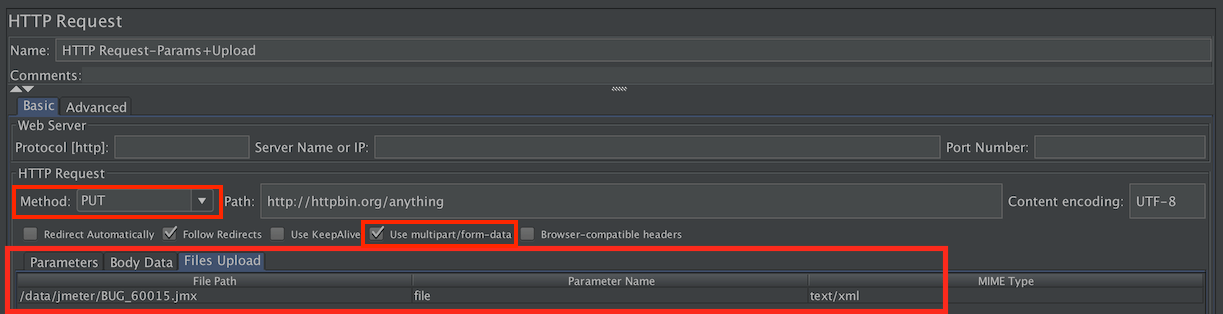
- JMeter now takes into account parameters in “Send Parameters with the request” not only for POST and GET as it was previously the case, but for all methods that should apply
Working with SOAP
Although JSON based webservices keep growing in popularity, SOAP and XML are still present in many Enterprise applications.
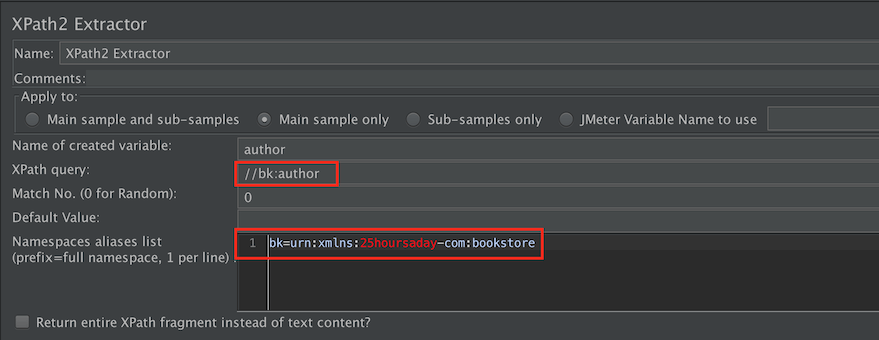
Working with XML in previous versions of JMeter had 3 drawbacks:
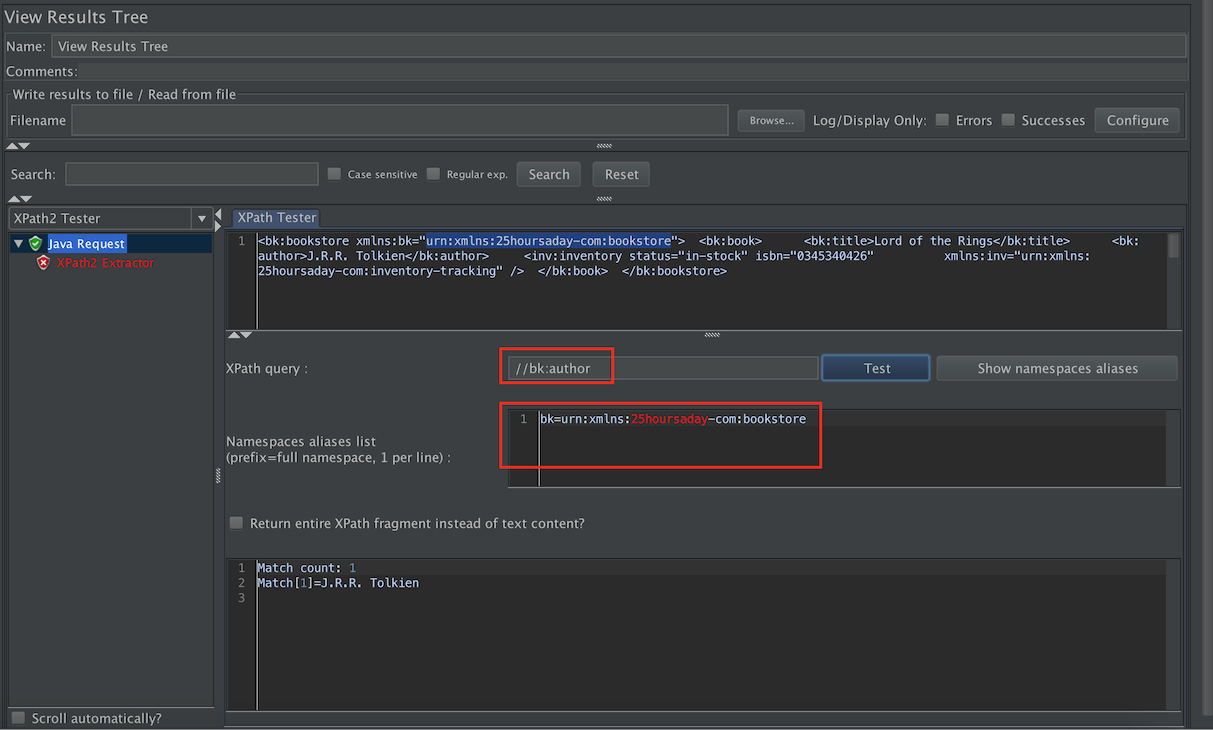
- Extracting data using XML namespaces was not easy, you had to configure namespaces aliasing in an external file and restart JMeter to load this file
- You couldn’t use XPath 2.0 features
- XPath extractor was slow
So we decided to fix this.
We contributed a new XPath 2 Extractor which provides the missing features and performs more than 4 times better than old one.
Of course working with JSON is also very easy thanks to the JSON Extractor we contributed in version 3.0 of JMeter.
Correlating and variabilizing
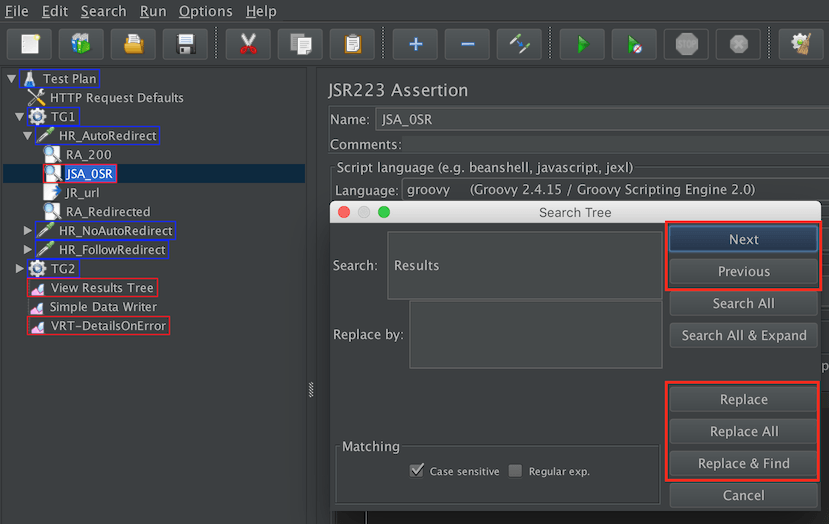
- Important improvements to Search feature (used for correlation) in JMeter now allow you to speed up correlation drastically when building your script. This feature also allows you to:
- do replacement of values in Headers and Requests by variables created by extractors from JSON, CSS Selectors, XPath, Boundary or Regular Expressions.
- more easily understand a script you need to maintain
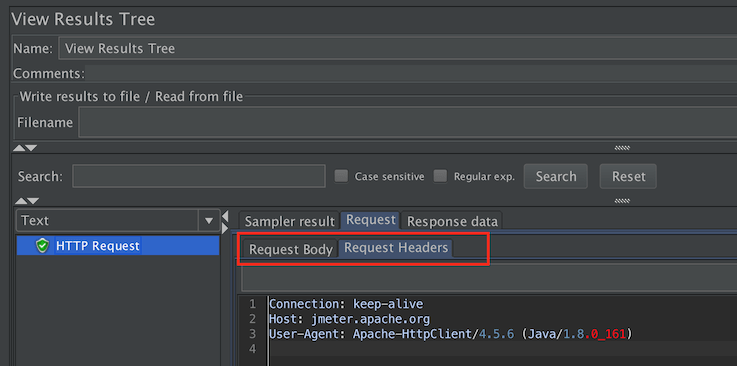
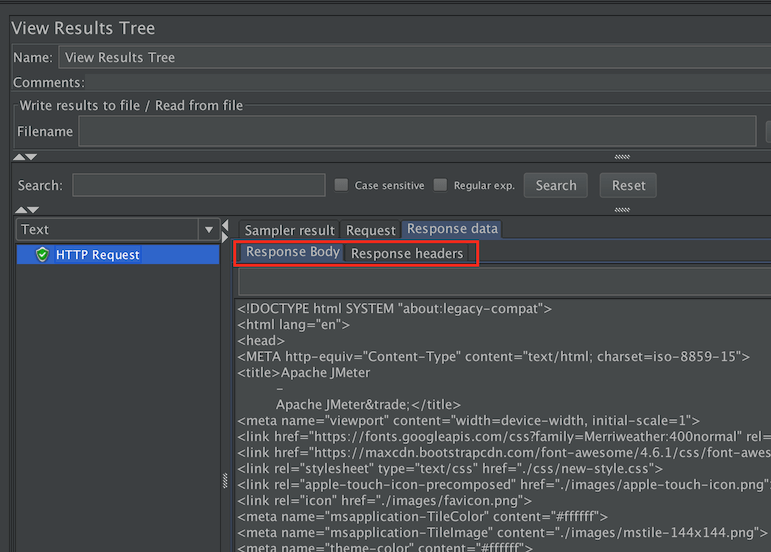
- The ergonomy of the most useful component for debugging your script, the View Result Tree has been improved. You can now clearly see headers and body of requests and responses
Your test will be more realistic
- With this version, there is a change in the way JMeter handles the HTTPS handshake. Previously it would keep the SSL state between iterations of main Thread Group loop. This was not realistic since usually a new loop is associated to a new user. With this version, the SSL state is reset on each iteration making simulation of HTTPS more realistic
- Migration to new HC4.5 client API. This is very technical but ensure that JMeter keeps up to date with HTTP protocol and last RFCs.
You’ll analyze your test easily
Web Report enhancements
There are a lot of preconceived ideas about JMeter lacking rich reporting. I keep seeing many blogs spreading this wrong information.
Well, let’s repeat it, YES JMeter HAS RICH NATIVE REPORTING. It appeared in version 3.0 and it keeps getting enhanced version after version.
As of version 5.0, the HTML report that you can generate at end of Load Test or from existing CSV file has:
- 4 Tables (Apdex, Statistics, Errors, Top 5 errors by sampler)
- 17 Graphs split in 3 groups (Over Time, Throughput, Response Times)
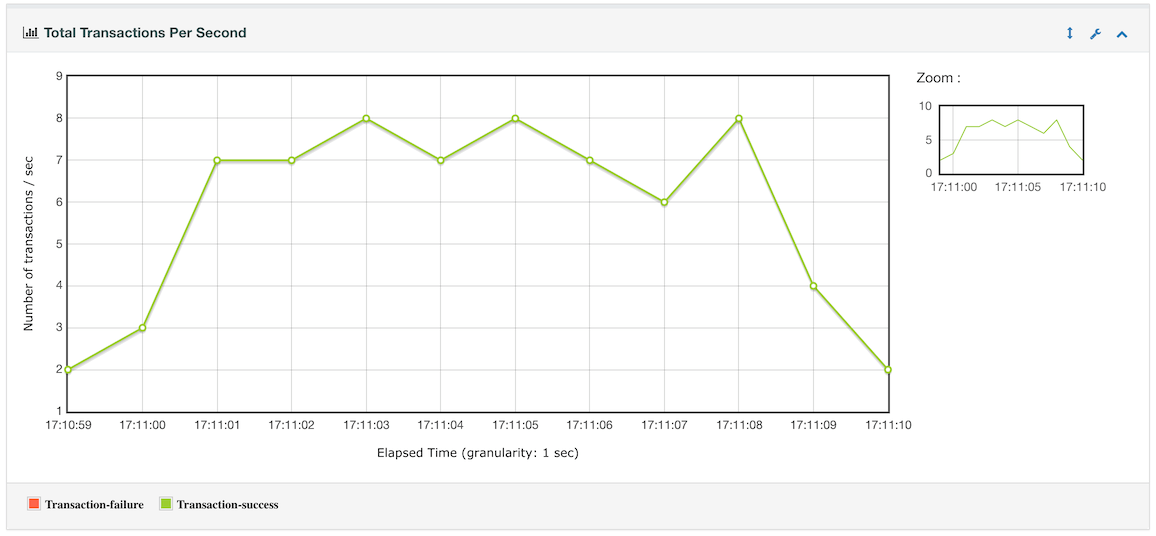
This version adds a new graph “Total Transactions Per Second” :
Even more powerful, you are now able to graph over time any variable you compute.
We contributed this feature as we needed it within our Video Streaming Plugin. Indeed this commercial plugin which simulates Player reading Live or VOD video streams (HLS, MPEG-DASH,HSS, HDS), provides additional metrics related to User Experience.
We could have built this feature in a proprietary and closed way, but we wanted to provide the community with a feature that looks important to us and would be useful to the community.
Yes it takes more time than building closed source, but we believe sharing it better.
We use this feature in our UbikLoadPack Video Streaming plugin to allow graphing our custom metrics, see “Example for Lag Ratio over time” in this blog.
Live Report enhancements
JMeter since many version is able to send metrics to Real-Time series databases like Graphite and the famous and great InfluxDB.
With this version, JMeter adds
- sent bytes
- receive bytes
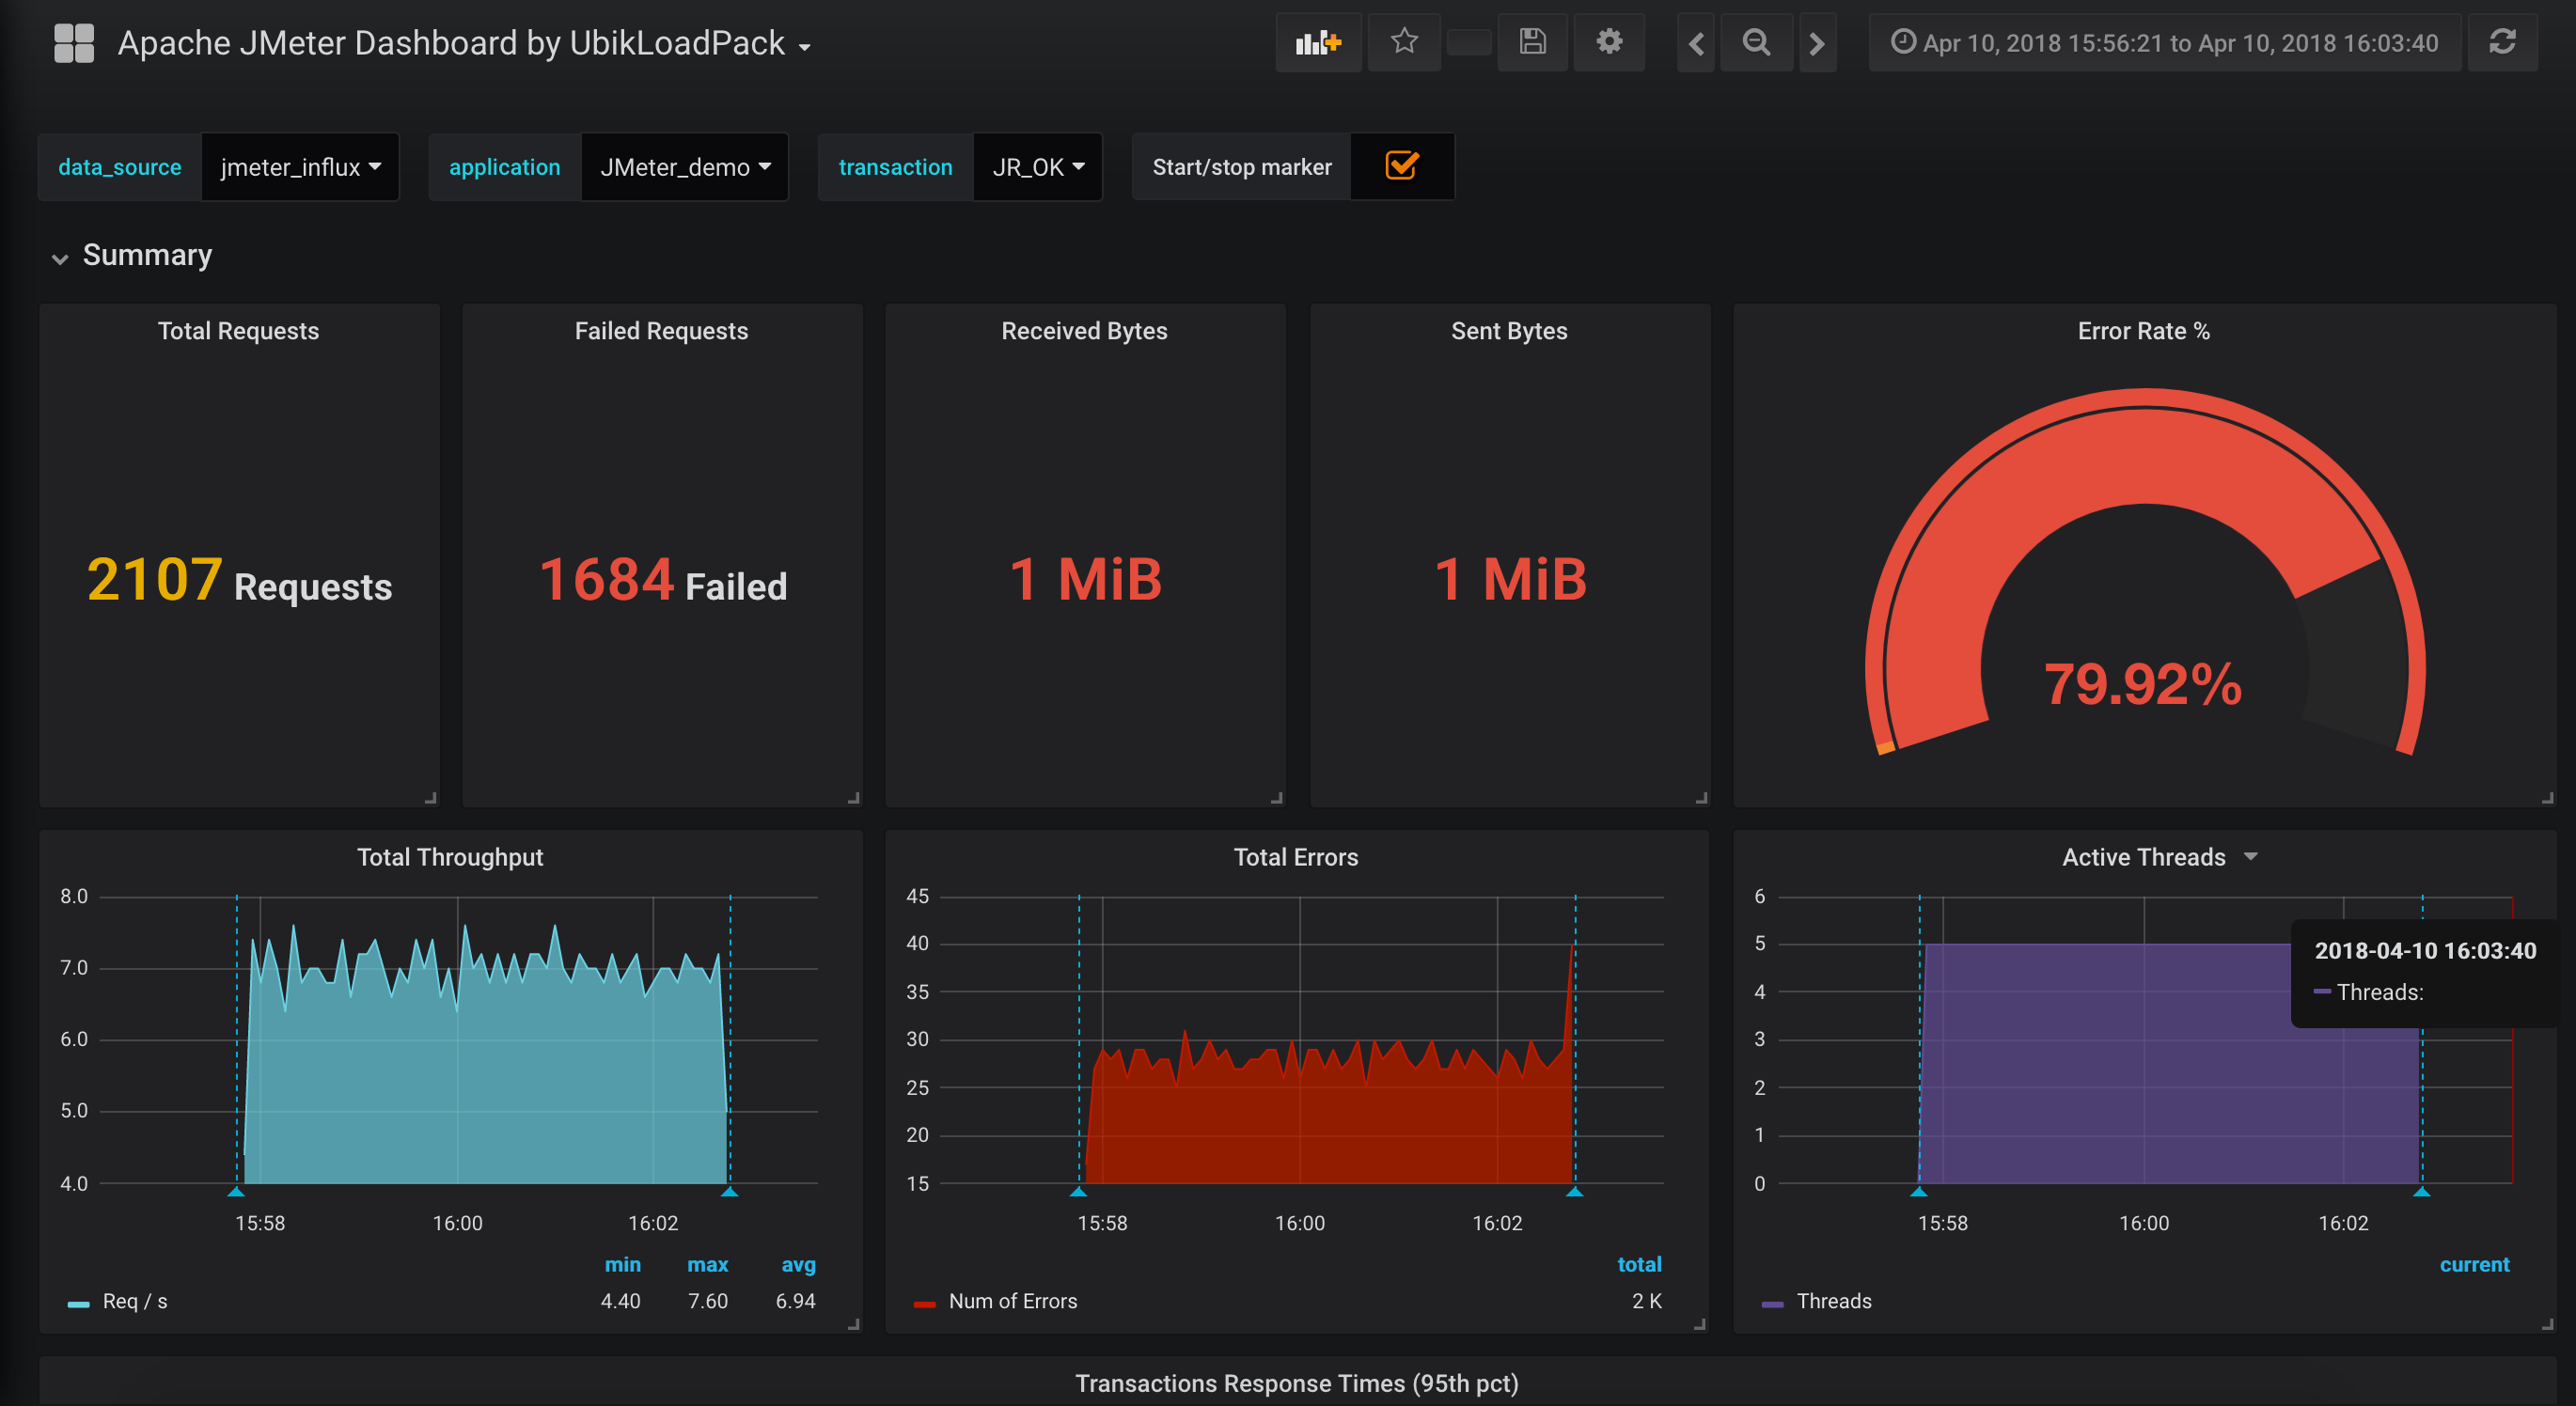
We contributed this Grafana report you can use to graph metrics in InfluxDB.
JMeter 5.0 has a total of 54 enhancements and 41 bug fixes.
For full details, read JMeter release notes
About author:
Philippe Mouawad is a developer, committer and member of the JMeter Project Management Committee at Apache.
He is also the co-author of the book Master JMeter : from load testing to DevOps
He currently works as an Architect and technical expert for Ubik-Ingenierie where he leads among other things the development of UbikLoadPack a set of Commercial Plugins for Apache JMeter allowing to load test different protocols like MPEG-DASH, Http Live Streaming, HSS, HDS, GWT, JavaSerialization.
Try it:
Request a trial version HERE.
Ask for a turnkey or consulting service at ubik-load-pack-sales@ubik-ingenierie.com.
About us :
- We provide professional services for Load Testing
- We’re strong contributors to JMeter and its eco-system
- UbikLoadPack is a set of Enterprise Grade plugins for Apache JMeter. Our solutions are used by Big players
- Get a Free trial
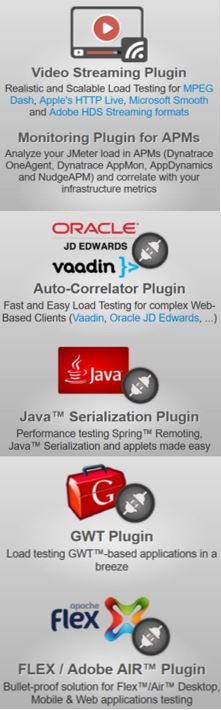
UbikLoadPack solution

![]()
Publication
![]()
