
Shift left your performance tests with JMeter and Maven
Integrating Performance Testing in your Continuous Integration (CI) process has many benefits:
- Provide constant check of the performances of the application
- Secure continuous delivery in production
- Allow early detection of performance problems or performance regressions
- Automate the process means less manual work, allowing your team to focus on more valuable tasks like performance analysis and optimisation
In this blog we will see how you easily configure your project to run performance tests using:
- Apache Maven : the Open Source well known build tool
- Apache JMeter : the Open Source reference for Load Testing
- A third party Open Source JMeter plugin that will allow us to configure how load is injected
Components used:
jmeter-maven-plugin
This Maven plugin initially developed by LazeryCode is now maintained by our Lead Developer and JMeter committer.
We’ll use last version 2.8.3 that we sponsored which improves dependency management.
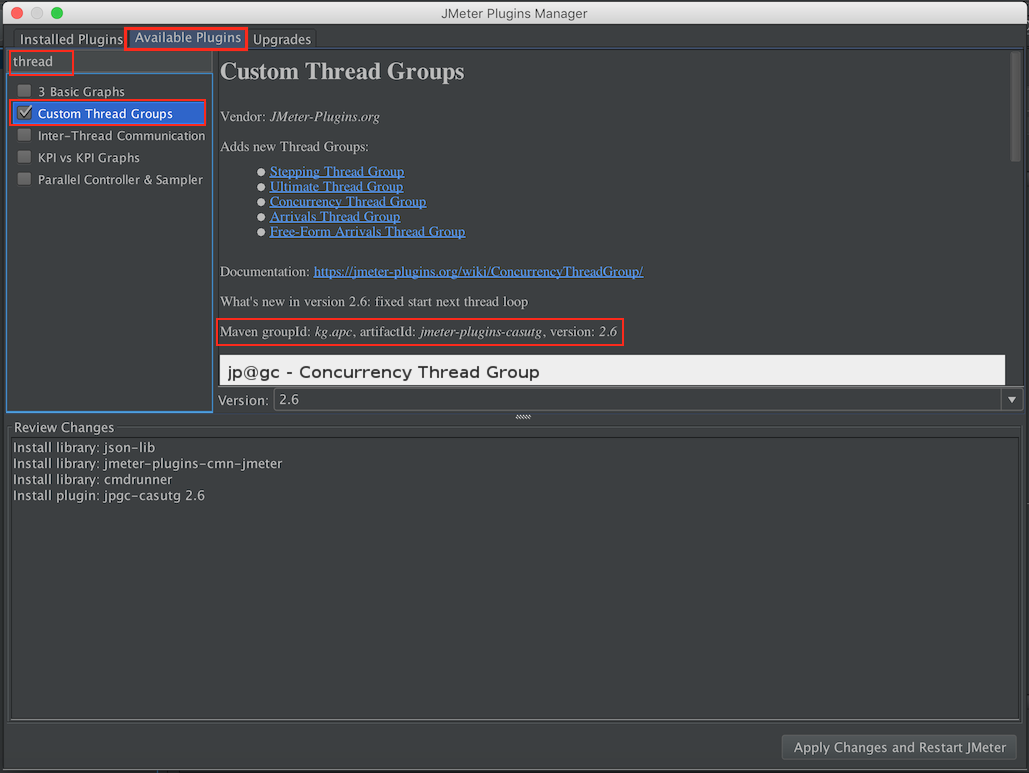
jmeter-plugins-manager and
Ultimate Thread Group
Ultimate Thread Group plugin will allow us to visually configure the load to inject. Read this blog to see how to install it through plugins-manager.
The nice thing about plugins-manager is that it shows you the Maven artifacts information of the plugin (this is a contribution we made), see in screenshot below:
- groupId : kg.apc
- artifactId: jmeter-plugins-casutg
- version: 2.6
Project configuration:
The setup is done as usual with Maven by creating a pom file, the full file is here: pom.xml.
The jmeter-maven-plugin is configured with this pom. We’ll highlight most important parts.
We put the JMeter test plan mvn-demo.jmx in src/test/jmeter, we end up with following layout:
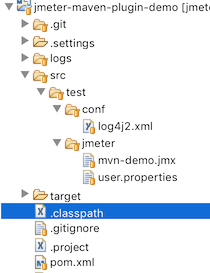
- Notice log4j2.xml to control jmeter logs is in src/test/conf
- user.properties is in src/test/jmeter
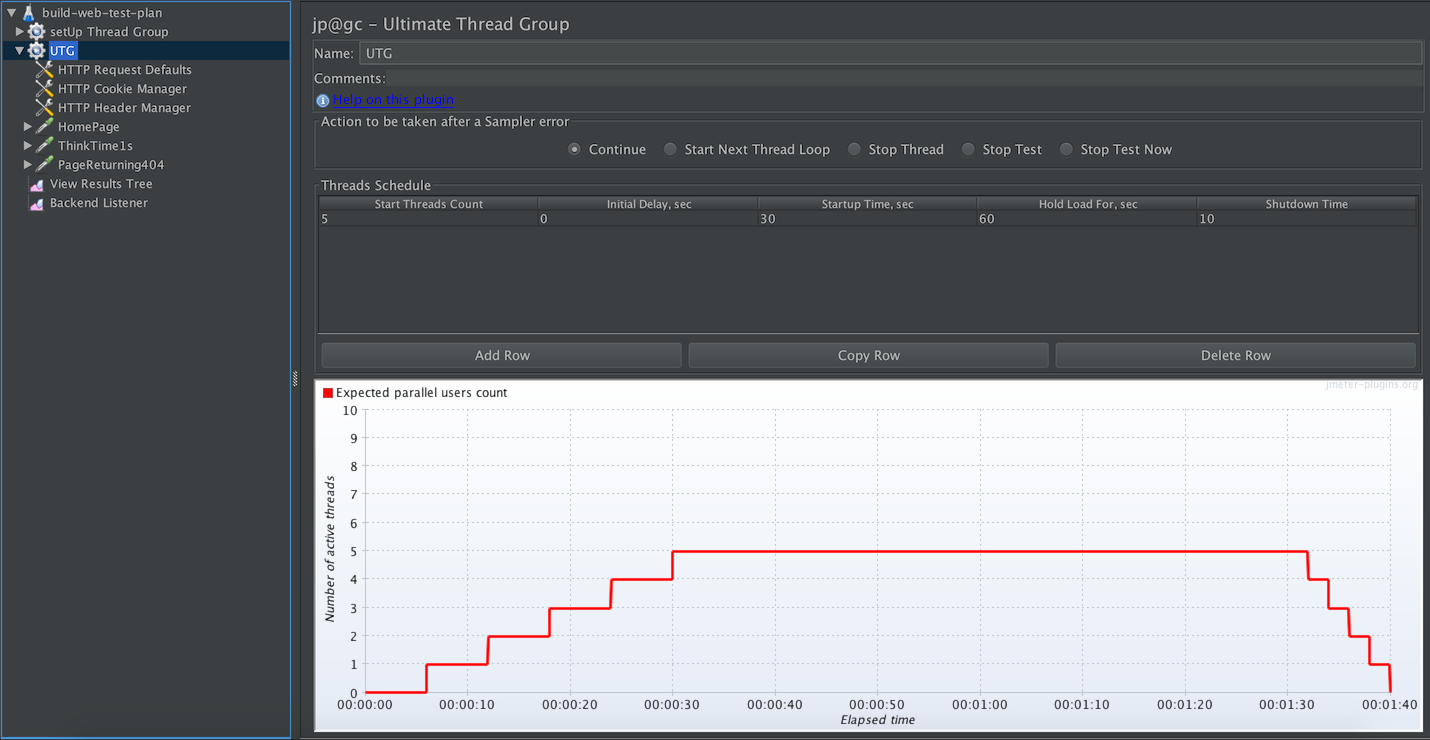
Using the Ultimate Thread Group Plugin
To use the plugin, right click on Test Plan node and select Add > Threads > Ultimate Thread Group, then configure rampup and plateau:
Using jmeter-maven-plugin
We first declare the jmeter-maven-plugin <plugin> tag inside <build> element:
<build>
  <plugins>
    <plugin>
      <groupId>com.lazerycode.jmeter</groupId>
      <artifactId>jmeter-maven-plugin</artifactId>
      <version>2.8.3</version>
      <configuration>
....
      </configuration>
      <executions>
....
      </executions>
    </plugin>
  </plugins>
</build>
Which goals to run
We then declare which goal we want to run and to which build phase it is attached.
In the code below we will be running 2 goals:
- jmeter in phase verify: This goal will run the load test and generate the HTML report
- results in phase verify: This goal runs some verification on error rate and fails the build
<executions>
  <execution>
    <id>jmeter-tests</id>
    <phase>verify</phase>
    <goals>
      <goal>jmeter</goal>
    </goals>
  </execution>
  <execution>
    <id>check-results</id>
    <phase>verify</phase>
    <goals>
      <goal>results</goal>
    </goals>
   </execution>
</executions>
Dependencies configuration
We configure the dependency for Ultimate Thread Group plugin as child of <configuration> element:
<jmeterExtensions>
     <artifact>kg.apc:jmeter-plugins-casutg:2.6</artifact>
 </jmeterExtensions>
 <excludedArtifacts>
    <exclusion>org.slf4j:slf4j-nop</exclusion>
    <exclusion>avalon-framework:*</exclusion>
    <exclusion>org.apache.tika:*</exclusion>
    <exclusion>excalibur-datasource:excalibur-datasource</exclusion>
    <exclusion>excalibur-instrument:excalibur-instrument</exclusion>
    <exclusion>excalibur-logger:excalibur-logger</exclusion>
    <exclusion>excalibur-pool:*</exclusion>
    <exclusion>org.beanshell:bsh:jar:2.0b5</exclusion>
 </excludedArtifacts>
Build failure configuration
We configure build to fail when error rate exceeds 1%. This is also done in a child of <configuration> element:
<errorRateThresholdInPercent>1</errorRateThresholdInPercen
Passing properties to JMeter
We frequently need in JMeter to externalize some settings that come from command line (remember to never touch XML in JMeter) using __P function, for example to configure number of threads we would use this:
${__P(threads,5)
To pass the properties from Maven to JMeter, we add under <configuration> node:
<propertiesJMeter>
     <BUILD_TAG>${project.version}</BUILD_TAG>
     <threads>7</threads>
     <duration>30</duration>
 </propertiesJMeter>
Notice we can even use maven properties like ${project.version}.
We also pass some configuration parameters for the report that we put in user.properties file in src/test/jmeter:
jmeter.reportgenerator.report_title=JMeter with Maven Demo
jmeter.reportgenerator.exporter.html.series_filter=^(HomePage|PageReturning404)(-success|-failure)?$
jmeter.reportgenerator.overall_granularity=1000
JVM Configuration
We also adjust some JVM settings, always by adding a child under <configuration> element:
<jMeterProcessJVMSettings>
     <arguments>
         <argument>-XX:MaxMetaspaceSize=256m</argument>
         <argument>-Xmx1024m</argument>
         <argument>-Xms1024m</argument>
     </arguments>
 </jMeterProcessJVMSettings>
Running it
To run it, we open a console and input:
mvn clean install
We get the following output, notice build has failed as requested due to error rate exceeding 1%:
[INFO] Performance Test Results
 [INFO]
 [INFO] Result (.jtl) files scanned: 1
 [INFO] Successful requests:         245
 [INFO] Failed requests:             239
 [INFO] Failures:                    49.380165% (1.0% accepted)
 [INFO] ------------------------------------------------------------------------
 [INFO] BUILD FAILURE
 [INFO] ------------------------------------------------------------------------
 [INFO] Total time: 01:15 min
 [INFO] Finished at: 2019-01-15T15:58:07+01:00
 [INFO] Final Memory: 24M/526M
 [INFO] ------------------------------------------------------------------------
 [ERROR] Failed to execute goal com.lazerycode.jmeter:jmeter-maven-plugin:2.8.3:results (check-results) on project jmeter-maven-plugin-demo: Failing build because error percentage 49.380165 is above accepted threshold 1.0.
...
We also get the HTML report generated under target/jmeter/report/
About the author:
Philippe Mouawad is a developer, committer and member of the JMeter Project Management Committee at Apache.
He is also the co-author of the book Master JMeter : from load testing to DevOps.
He currently works as an Architect and technical expert for Ubik-Ingenierie where he leads among other things the development of UbikLoadPack a set of Commercial Plugins for Apache JMeter allowing to load test different protocols like MPEG-DASH, Http Live Streaming (HLS), HSS, HDS, GWT, JavaSerialization, Oracle applications.
About us :
- We provide professional services for Load Testing
- We’re strong contributors to JMeter and its eco-system
- UbikLoadPack is a set of Enterprise Grade plugins for Apache JMeter. Our solutions are used by Big players
- Get a Free trial
UbikLoadPack solution

![]()

Publication
![]()
