
Reporting feature in JMeter
I read on a lot of tools comparisons, blogs, commercial solutions sheets that JMeter has “limited reporting” feature.
A a daily user of JMeter within our company’s professional services, this is either a comparison bias or obsolete information that is constantly repeated?
Indeed, JMeter provides Out Of The Box since version 3.0 (5 versions ago), a dynamic HTML report that as of version 5.0 provides:
- Seventeen (17) graphs for response times, throughput, response codes, percentiles, network traffic…
- Four (4) tables including results statistics, top errors, Top 5 errors by Sampler and APDEX
Is this what you would call “limited reporting” ?
So I decided to write this blog to definitely clarify how this report feature works.
If you see room for improvements, then please DM me on my twitter @philmdot
Note that our company initially donated this report to Apache JMeter project.
Report configuration steps
Pre-requisites
Let’s start with this sample test plan that comes from a recording.
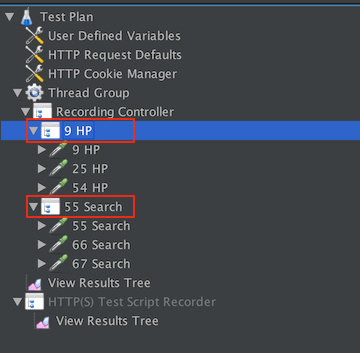
- Notice in red the “Transactions” that represent a click.
- Under each transactions you have the HTTP requests emitted
Respect pre-requisites
The only pre-requisites is that if you use Transaction Controller element, then you should keep default configuration where Generate parent sample is unchecked.
If you don’t, the output CSV will be missing detailed informations on some Samplers and some graphs/tables will be empty or not detailed enough, examples:
- Top Errors
- Top Errors by Samplers
- Response code over time
Apply Naming Policy
The first step is to rename the transactions that will figure in report to give them meaningful names.
Those names will appear in the HTML report shown to your management, in our case:
- HP (for Home Page)
- Search
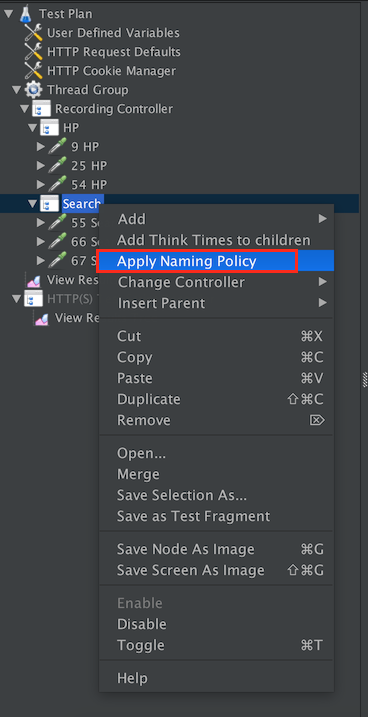
Then for each of those transactions, right click and select Apply Naming Policy:
We end up with this result:
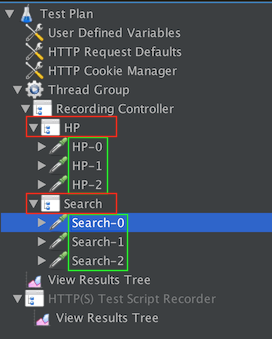
- Notice the numbering of requests with their parent transaction name as prefix
Configure required properties for your report
There are a four properties that are purely specific to your plan.
Uncomment them in user.properties and update their default value:
The title of your report:
- jmeter.reportgenerator.report_title=My awesome application
The granularity of graphs in millis (defaults to one minute):
- jmeter.reportgenerator.overall_granularity=1000
The APDEX satisfied and tolerated thresholds in millis:
- jmeter.reportgenerator.apdex_satisfied_threshold=500
- jmeter.reportgenerator.apdex_tolerated_threshold=1500
And most importantly, the transactions you want in report:
- jmeter.reportgenerator.exporter.html.series_filter=^(Search|Order)(-success|-failure)?$
Hopefully, you can use a helper menu to generate this last property from your plan, Help > Export transactions for report:
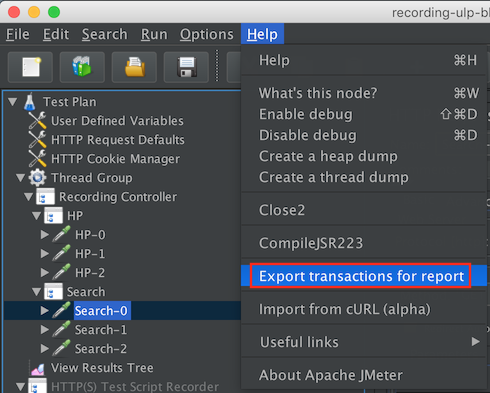
You’ll get:
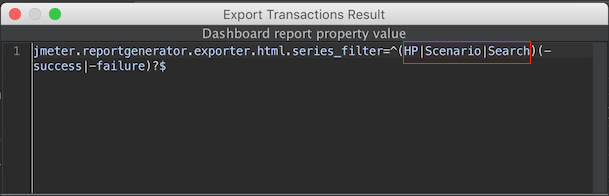
Copy the line and paste it in user.properties. Remove any unneeded transaction in red rectangle.
Report generation steps
Now you have two possibilities:
Generate report at end of load test
To generate the report at end of load test, just issue:
<jmeter folder>/bin/jmeter -n -t <path to Test plan file> -l <csv output file> -e -o <Path to output folder>
If the “Path to output folder” folder is not empty or “csv output file” exists, JMeter will not overwrite them and exit with failure. So you need to either clean them up or add “-f” option to overwrite them.
Generate report from existing CSV
To successfully do this generation, you just need to ensure you use the same user.properties file for generation that you used for running the load test.
The command line is then:
<jmeter folder>/bin/jmeter -q <path to folder containing the custom user.properties>/user.properties -g <CSV file generated by load test> -o <Path to output folder>
If the “Path to output folder” folder is not empty, JMeter will not overwrite it, so you need to either clean it up or add “-f” option to overwrite content of folder.
The report
Go to the report folder and open it in your browser. You’ll get something like this.
About the author:
Philippe Mouawad is a developer, committer and member of the JMeter Project Management Committee at Apache.
He is also the co-author of the book Master JMeter : from load testing to DevOps.
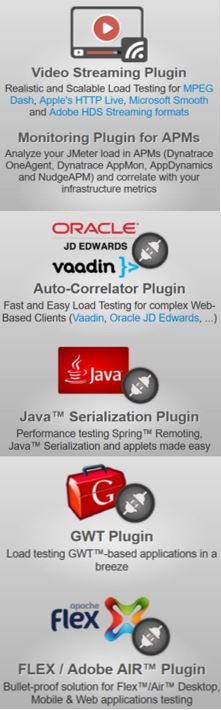
He currently works as an Architect and technical expert for Ubik-Ingenierie where he leads among other things the development of UbikLoadPack a set of Commercial Plugins for Apache JMeter allowing to load test different protocols like MPEG-DASH, Http Live Streaming (HLS), HSS, HDS, GWT, JavaSerialization, Oracle applications.
About us :
- We provide professional services for Load Testing
- We’re strong contributors to JMeter and its eco-system
- UbikLoadPack is a set of Enterprise Grade plugins for Apache JMeter. Our solutions are used by Big players
- Get a Free trial
UbikLoadPack solution

![]()
Publication
![]()
