This video tutorial is a demo of reporting feature of Apache JMeter.
It shows how to configure your test plan and the setup required to generate the HTML dynamic report of JMeter which contains a wealth of informations to analyze your load test.
Demo of reporting feature of Apache JMeter
Generate a report
Beforehand : Create a test plan using recording
First of all, you will need to create the Test Plan.
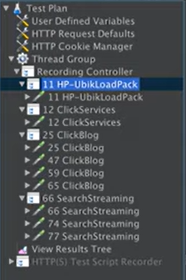
⇒ JMeter has recorded the different requests when you click on clickblog of your website.
You have something like this:
To create your test plan :
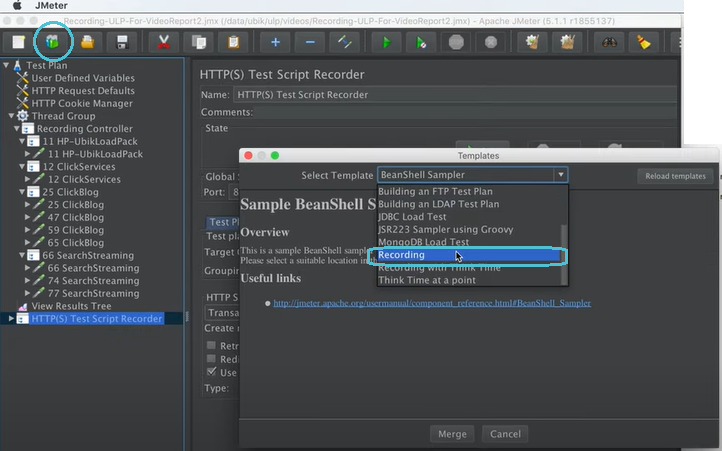
1- You can use the recording template:
On the toolbar, click on the option “Templates”
Select the template “Recording” into the list of available templates
Click on the button “Create” or “Merge”
2 – You can do your recording by navigating on your website and recording some transactions. JMeter will create on each click, a transaction controller and children composed of http request made on each click.
Step 1 : Correlate the test plan
This is out of scope of this demo as it can depend on the technology your application relies on.
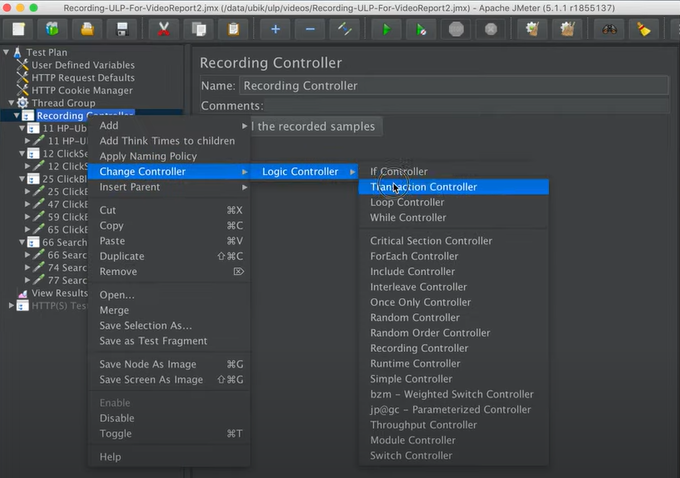
Step 2 : Transform Recording Controller into a Transaction Controller
The second step will be to transform this recording controller into a transaction controller because it’s usually the component used to group a set of transactions.
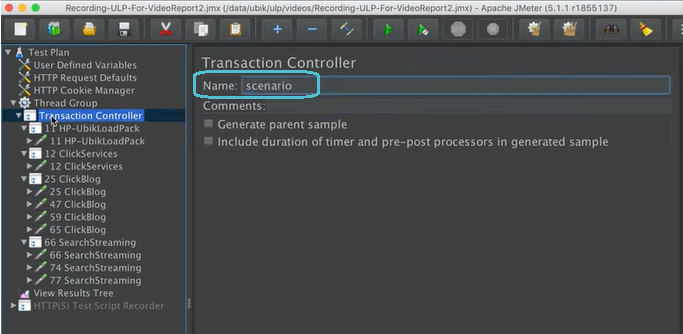
3. Rename this Transaction Controller (in our example : scenario).
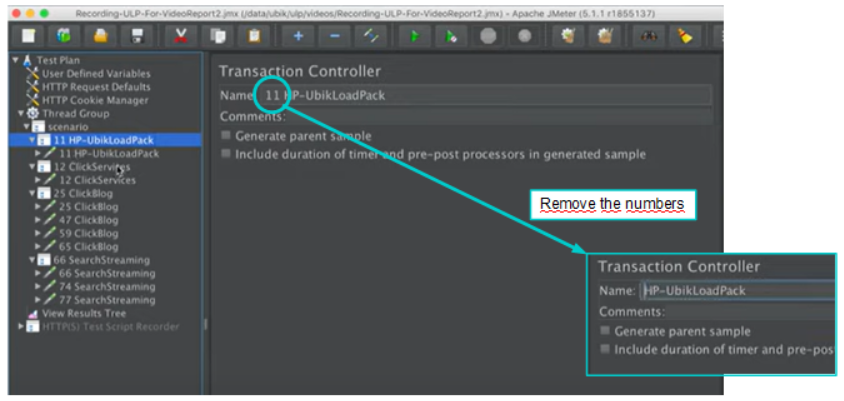
4. To have meaningful names for your management, and a nice and clean report :
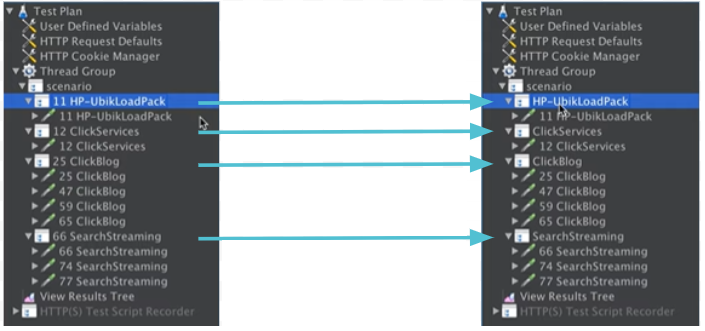
a. Remove the numbers on all transactions as JMeter has set one during recording to identify uniquely every click in View Results Tree.
⇒ All transactions were renamed.
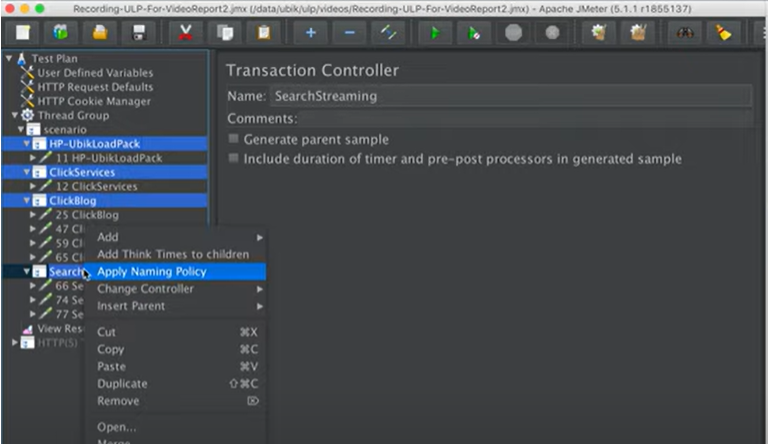
b. Select all those transactions and right click on “apply naming policy”.
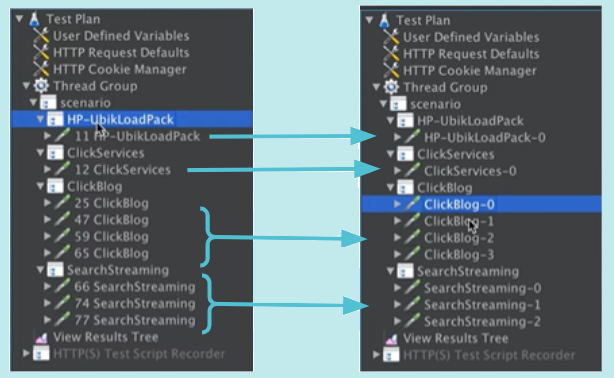
⇒ Result : JMeter has renamed the transaction so that it is able to generate the report correctly.
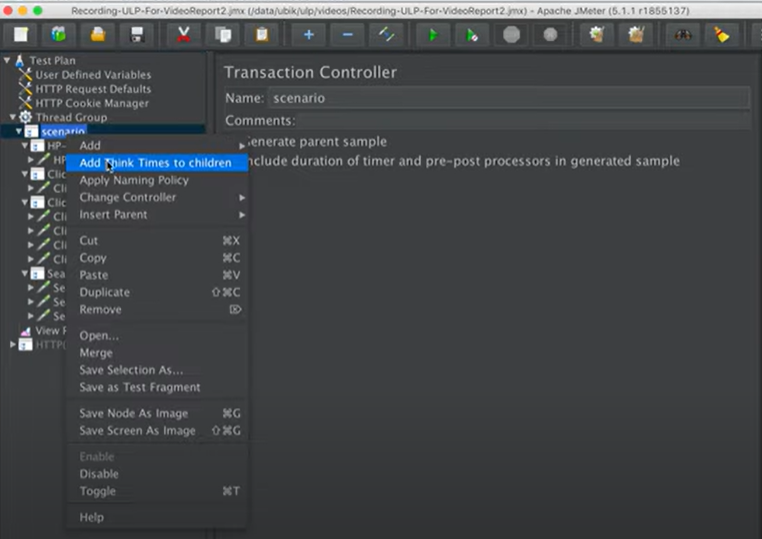
Step 3 : Add Think times to children
Beforehand, you would have also added a response assertion to your test plan to check that every request gives you the expected response.
1. Right click on your Transaction Controller.
2. Click on “Add Think Times to children”.
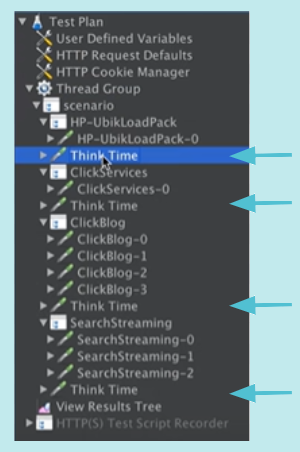
⇒ Result : Think times were added.
3. In every Think Time element, if necessary, adapt this pausetime depending on the transaction.
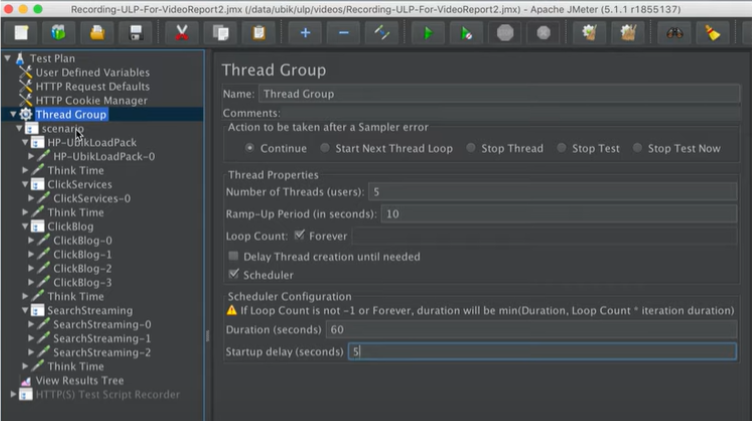
Step 4 : Setting up thread group
1. Click on Thread Group.
2. Set up the Thread Group to make a load test, complete :
Number of Threads (users)
Ramp-up period
Duration
Startup delay : to give JMeter warm up to avoid impacting to response time to warm up of JMeter.
Forever:
If checked : your users will be each time repeating the scenario infinitely.
Scheduler
In our example:
Our load test is composed of 5 threads, a 10 seconds ramp-up period.
Our test will last 60 seconds.
The thread will start only after 5 seconds.
⇒ Result : The test is ready.
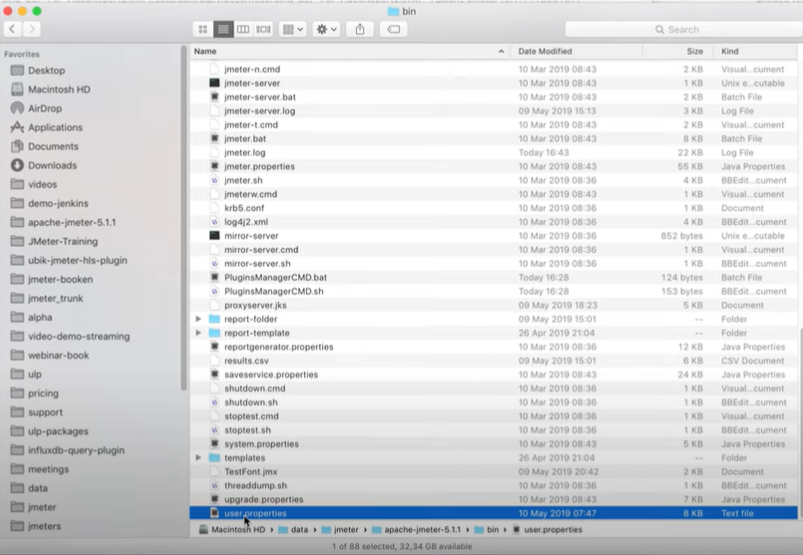
Step 5 : Configuration of report
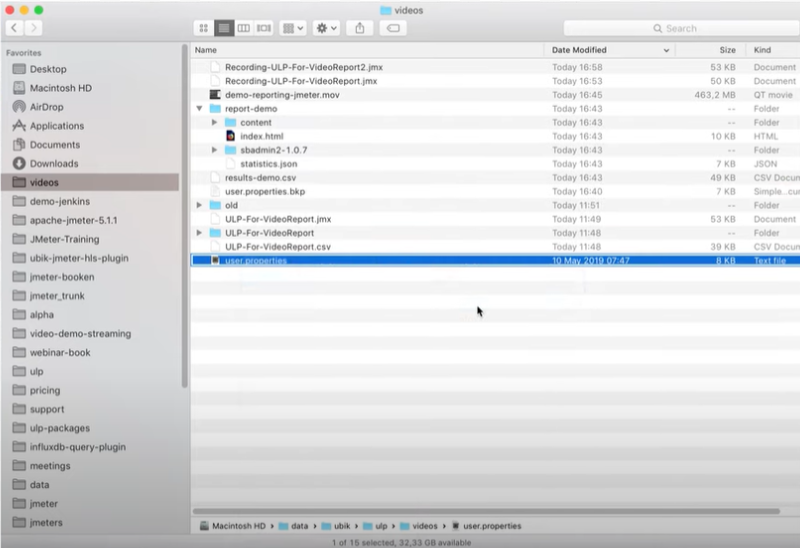
1. Copy the regular users.properties that you have in JMeter.
2. Put this file in your folder.
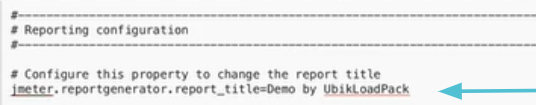
3. Open the file and update in the section “Reporting configuration”.
NB : The values that you put depend on your requirement.
a. Uncomment the title to give it a meaningful name. (In our example : Demo by UbikLoadPack)
b. Uncomment the overall_granularity to change the granularity of the points.
(In our example : Since our load test is very short for the demo, we reduce the granularity of the points to one second otherwise we would have the only point on the graph. )
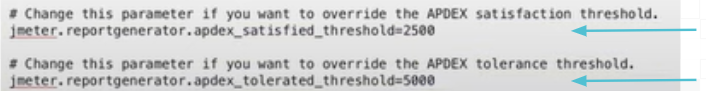
c. Uncomment the APDEX satisfaction threshold and APDEX tolerance threshold.
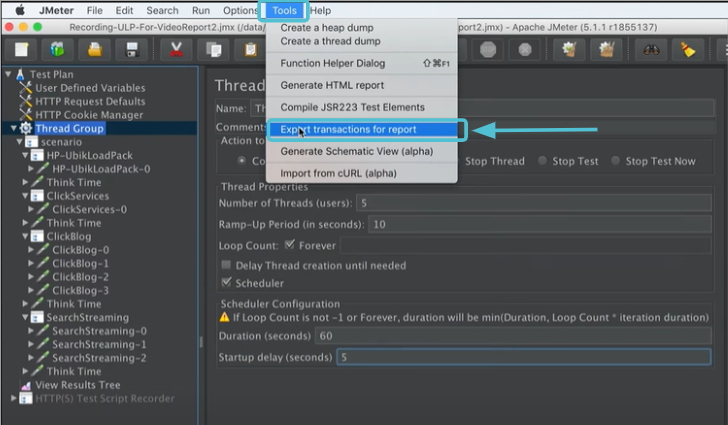
4. Configure the transactions to export.
a. Switch to JMeter.
b. On the toolbar, click on the option Tools >Export Transaction.
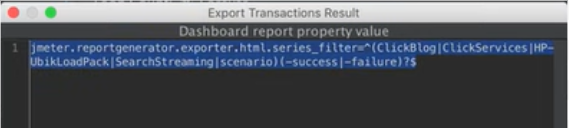
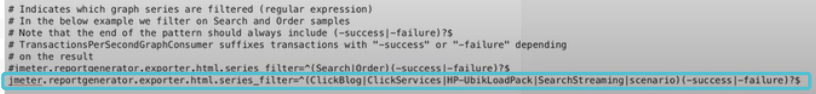
c. Copy the value of dashboard report property.
d. Paste it in the section “Reporting configuration” of the file.
e. Change filters according to transactions that you are interested in.
(In our example : For our test plan, we aren’t interested in ClickServices nor HP-UbikLoadPack. So we remove those transactions.)
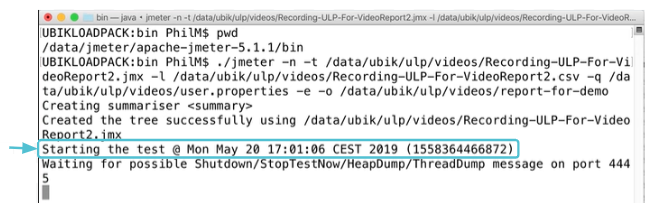
./jmeter -n -t [location of your test plan (.jmx)]
-l [location of the CSV output file (.csv)]
-q [location of your report configuration file (user.properties)]
-e -o /data/ubik/ulp/videos/report-for-demo
-n : non-GUI mode
-t : to reference your test plan (.jmx)
-l: to give the CSV output file (.csv). In convention, the same name as the test plan. This file contains all the timings of the request whether it’s in error or not.
-q : to tell JMeter to use your properties file (user.properties)
-e : to tell JMeter to generate the rapport on the group test.
In our example, it will run for 60 seconds as per our settings.
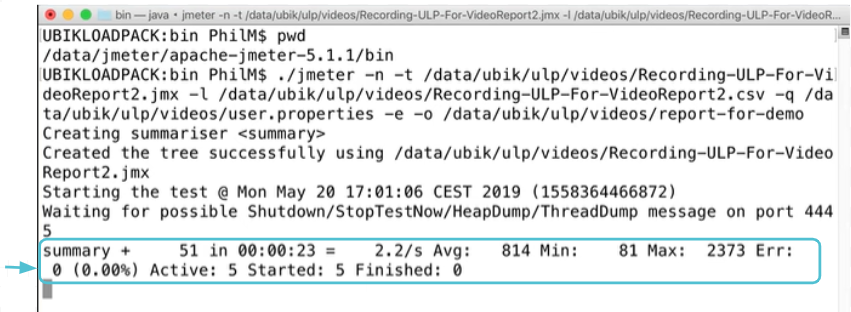
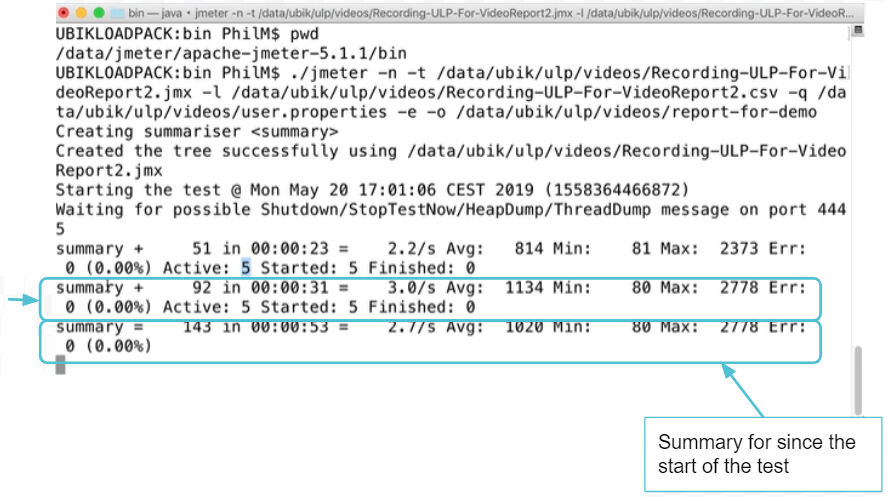
During the performance test run, JMeter gives an update of the test.
First Update of the test.
The test has been running for 23 seconds,
It has emitted 51 requests with average response time of 814 milliseconds, minimum of 81 milliseconds and maximum of 2373 milliseconds.
We have 5 threads running and 0% of errors.
Second update of the test
We have an update for the last 31 seconds and a summary for since the start of the test.
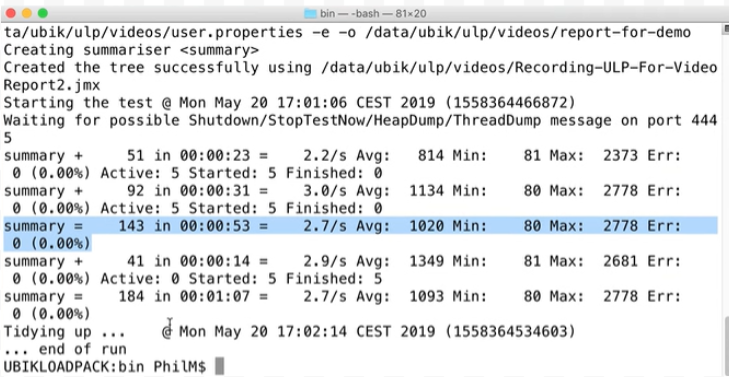
The test is finished.
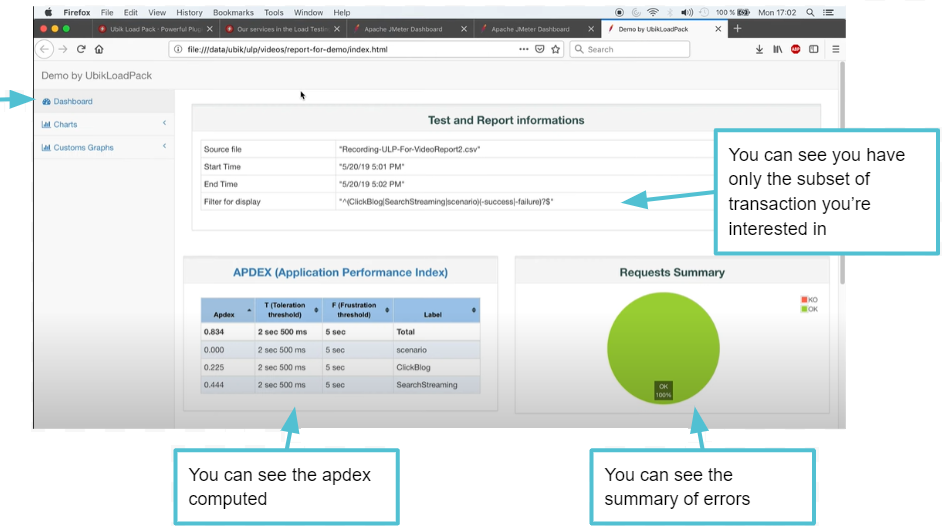
⇒ Result : It has generated a nice HTML report that contains a wealth of information.
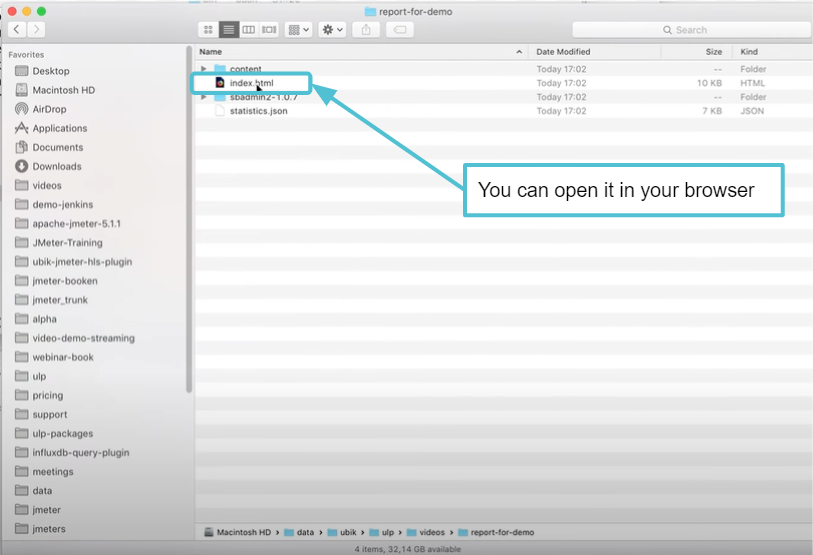
The report
Open the report in your browser.
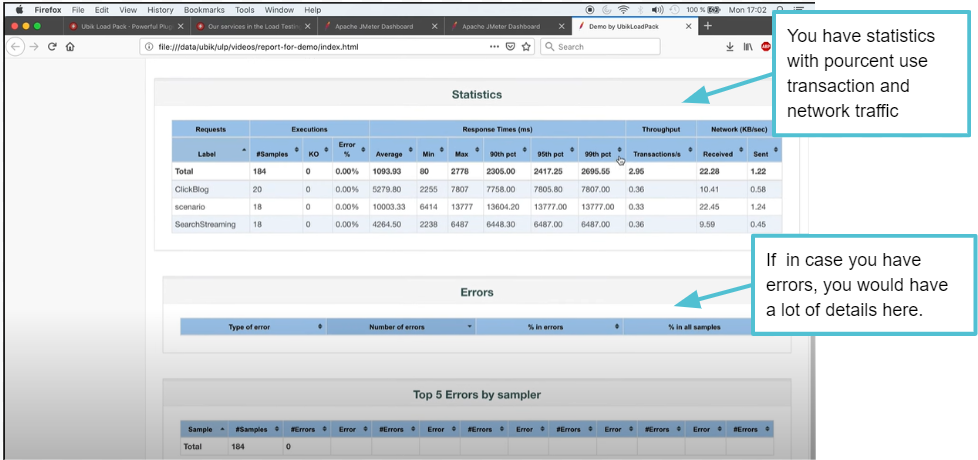
Dashboard
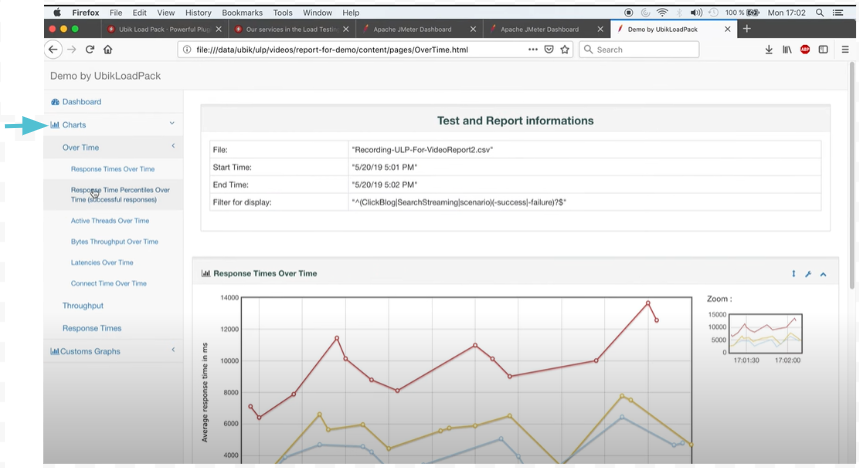
Charts
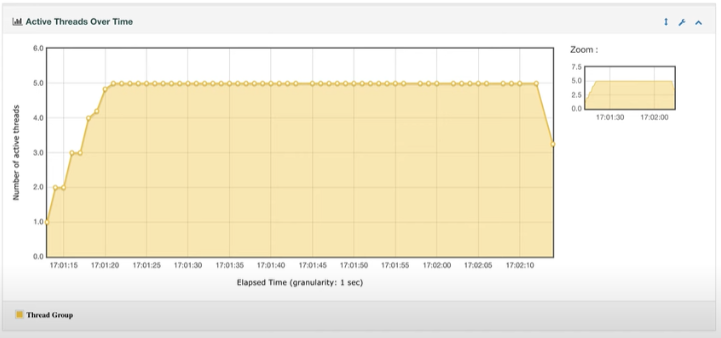
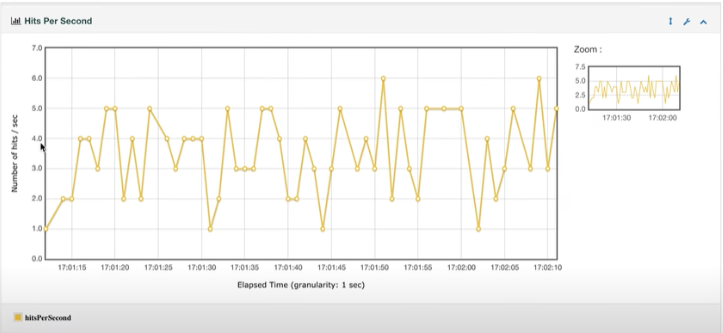
You can navigate between the different graphs using the menu on the left.
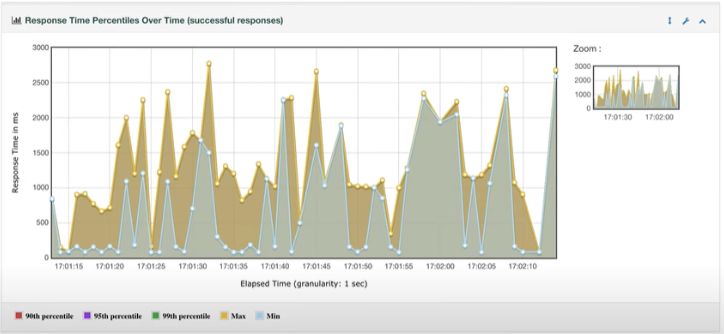
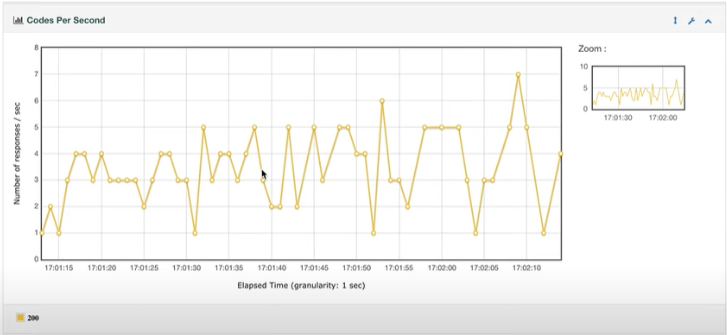
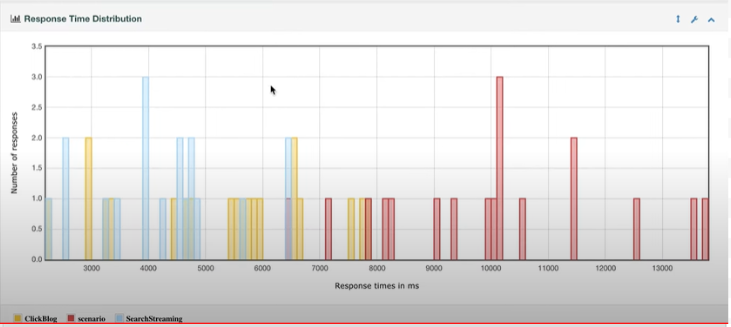
Here are some examples of graphs present in the report.
codes per second which is very useful when you want to analyze the type of error


response time distribution, which gives an idea of the response time of your test
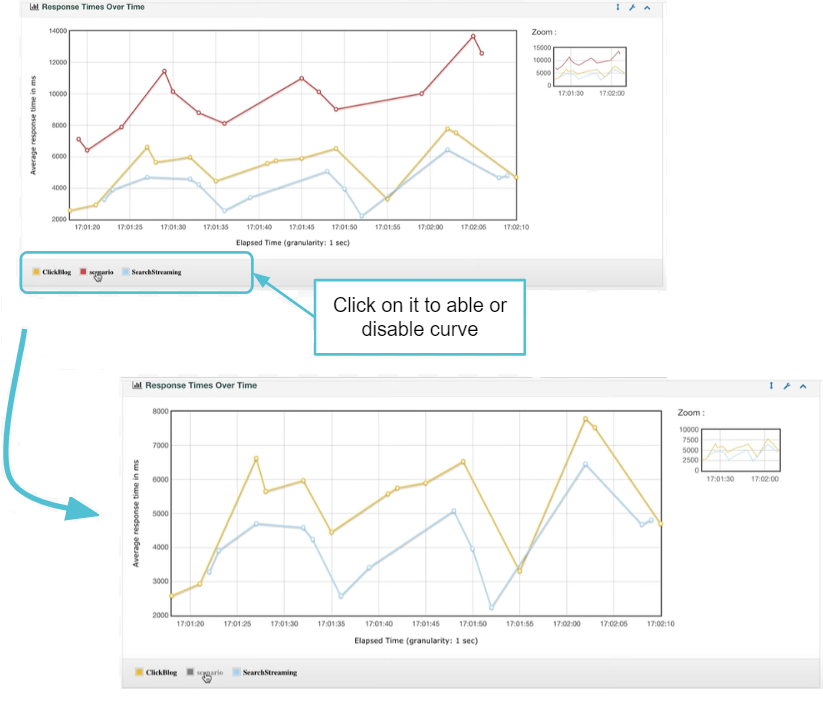
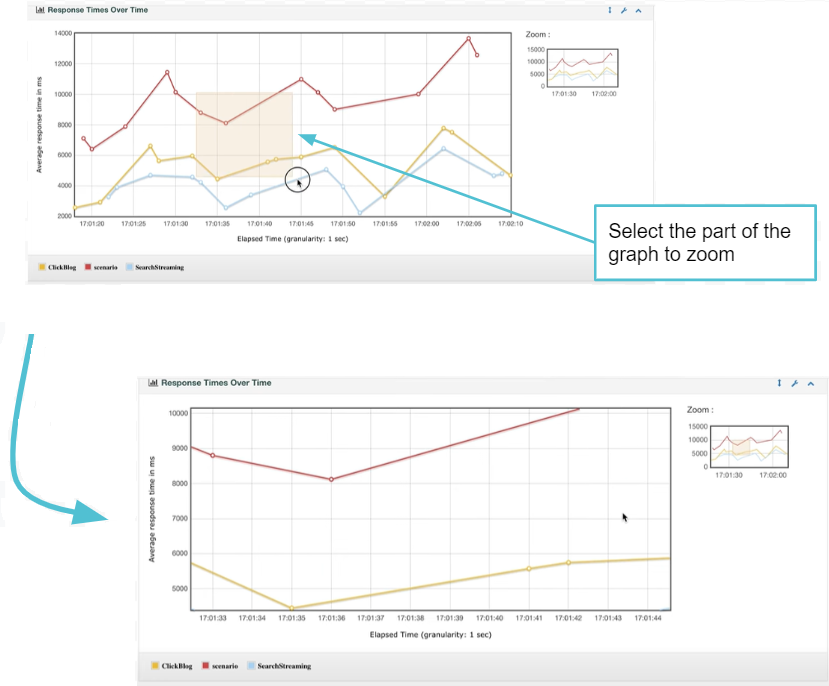
All those graphs are dynamic, so you can disable some curves, you can zoom…
Disable some curves
zoom
About the video presenter:
Philippe Mouawad is a developer, committer and member of the JMeter Project Management Committee at Apache.
He currently works as an Architect and technical expert for Ubik-Ingenierie where he leads among other things the development of UbikLoadPack a set of Commercial Plugins for Apache JMeter allowing to load test different protocols like MPEG-DASH, Http Live Streaming (HLS), HSS, HDS, GWT, JavaSerialization, Oracle applications.
About UbikLoadPack:
Ubik Load Pack is a set of Enterprise Grade plugins for Apache JMeter.
We’re strong contributors to JMeter and its eco-system
Nous utilisons des cookies pour vous garantir la meilleure expérience sur notre site. Si vous continuez à utiliser ce dernier, nous considérerons que vous acceptez l'utilisation des cookies.OKRefuse third party non functional cookiesEn savoir plus