

JMeter offers users a straightforward and user-friendly GUI.
The user can use elements like Thread Groups, Samplers, Processors, Controllers, Timers, etc. to build their performance test script.
JMeter GUI mode additionally provides the ability to view and examine the script’s outcome utilizing various Listeners.
Unfortunately, when running the performance test, JMeter GUI mode has the following drawbacks:
- Running JMeter in GUI, Java will favor the AWT Event Dispatcher Thread used to render GUI vs Threads running JMeter test
- When a test plan includes complicated test scenarios with several test steps and operations, JMeter GUI mode consume a lot of CPU and memory, which has an impact on the test results.
- The system will also slow down if more Listeners are added to the Test plan.
To avoid above issues and get the optimal results, you must run your JMeter scripts in Non GUI mode at the expense of analysis efficiency.
Introducing UbikLoadPack Observability Plugin
Fortunately, UbikLoadPack Observability plugin allows you to monitor your JMeter CLI performance test from your favorite browser without having to start JMeter in GUI mode.
This listener provides you with information and KPIs about your load testing results from a browser, making it simpler for you to decide on next steps for your website or app and allowing you to analyze the success of your performance tests.
Additionnally, it provides an endpoint at the OpenMetrics format that exposes those KPIs and make them available to compatible products like Prometheus.
How-to
- 0) First ensure you use a Java version >= Java 11
- 1) If you have not installed jmeter-plugins yet : get the jar from here, and put it in jmeter/lib/ext directory
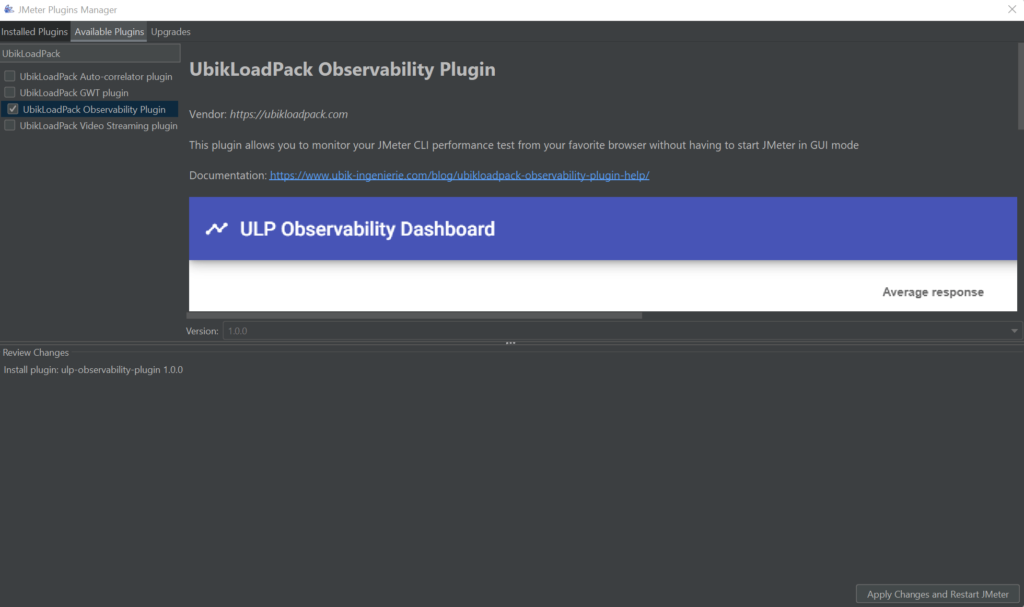
- 2) Once done, search for “UbikLoadPack Observability plugin” in the plugin manager and download it. You can use the search bar and type the plugin’s name to find it quickly if there is too much plugins.
- 3) After restarting JMeter add the plugin as a listener of Test plan.
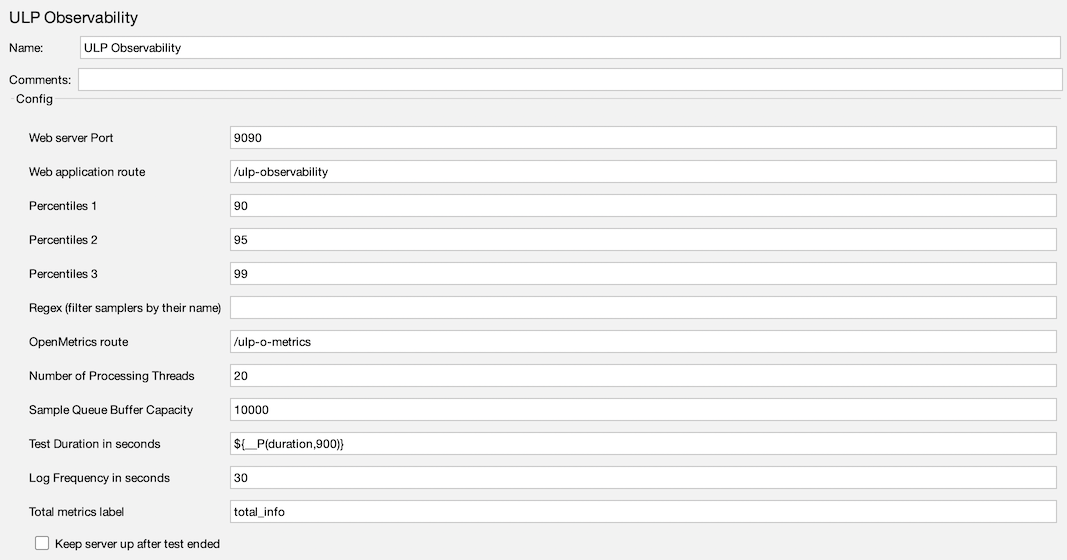
- 4) Tweak the plugin parameters to your needs or leave the default settings.
You can now start your test plan from GUI mode, non GUI mode, on local or distributed testing and access the result of your performance test in live time from your browser.
Plugin results
This plugin let you analyse your performance test results by plotting the following metrics in easy to read graphs:
- Average response
- Maximum response
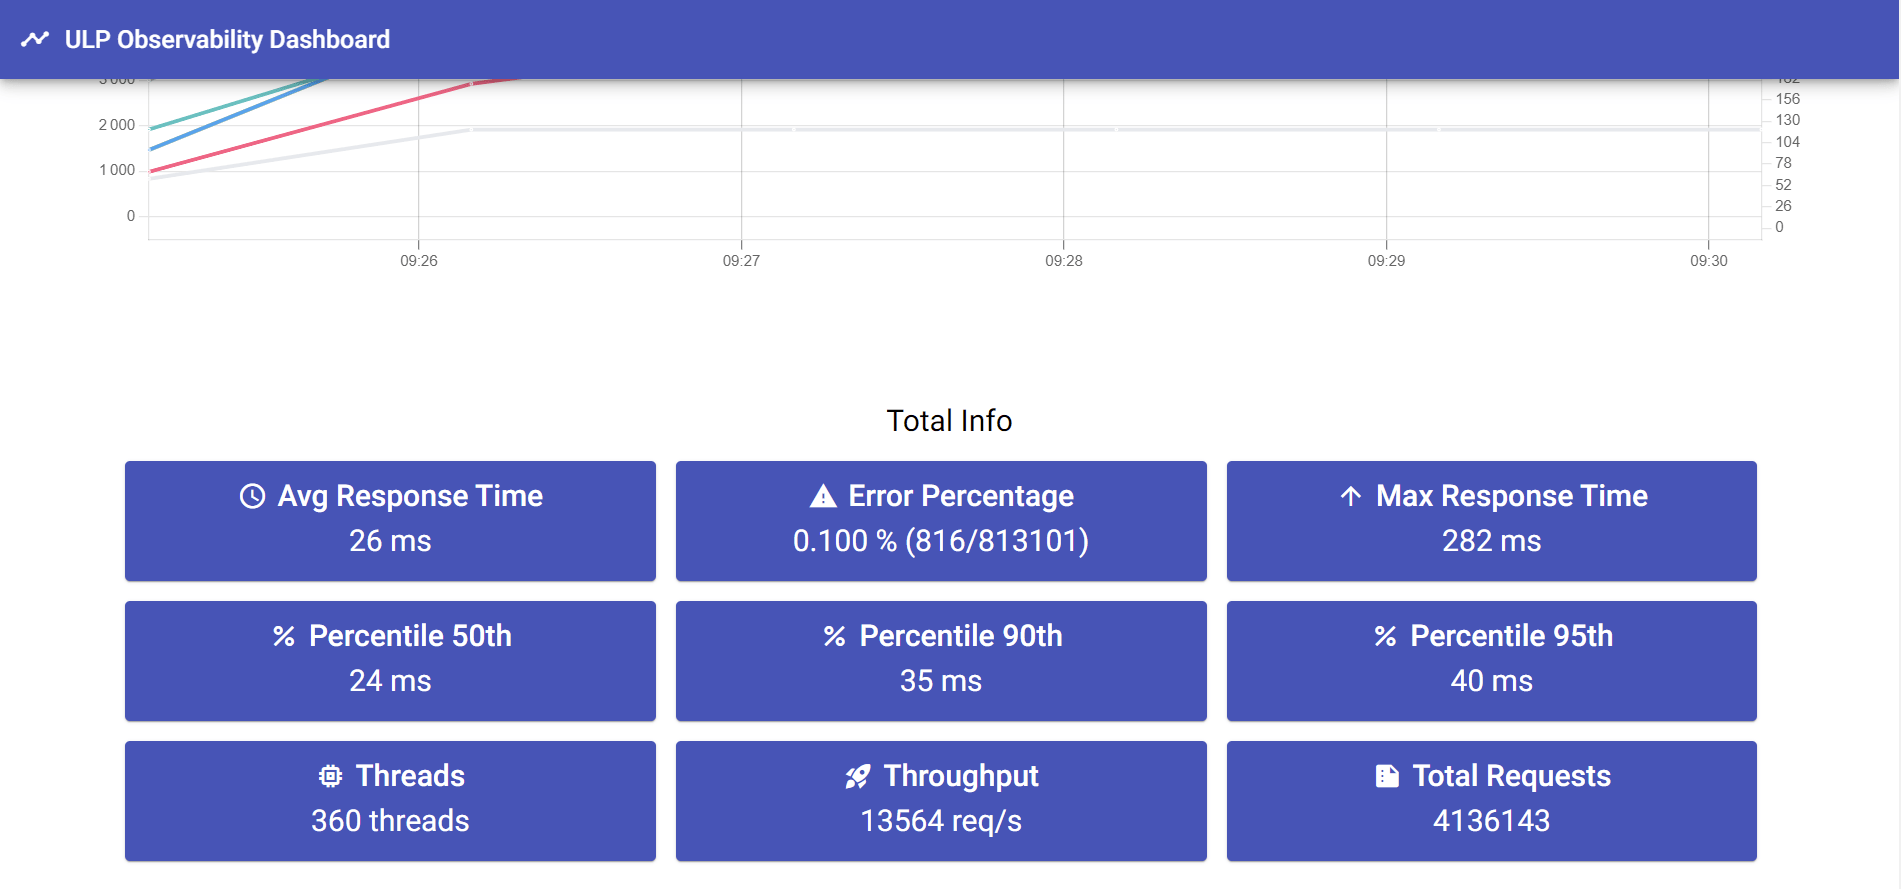
- Percentiles
- Error percentage
- Throughput
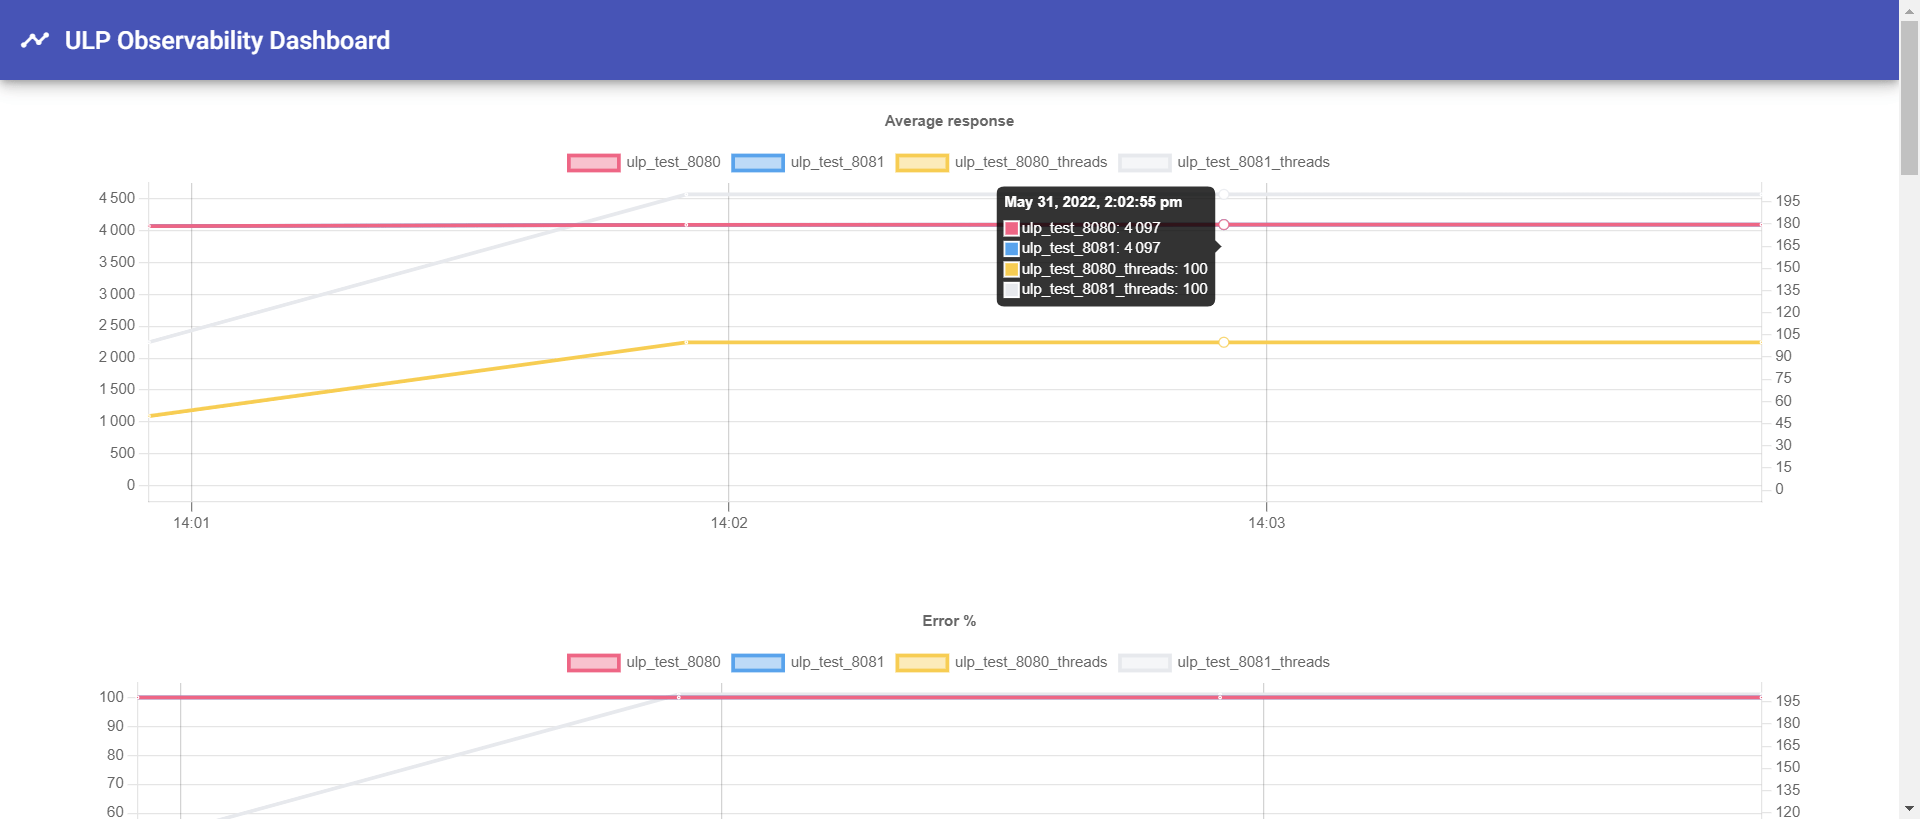
- Left y-axis : metric of each group of samples
- Right y-axis : cumulative number of threads in each group of samples
About UbikLoadPack:
- Ubik Load Pack is a set of Enterprise Grade plugins for Apache JMeter.
- We’re strong contributors to JMeter and its eco-system
- We provide professional services for Load Testing
- Free trial is available on https://ubikloadpack.com/tryout.p
UbikLoadPack solution

![]()

Publication
![]()
