
Overview
UBIK LOAD PACK OBSERVABILITY PLUGIN allows you to monitor your JMeter CLI performance test from your favorite browser without having to start JMeter in GUI mode.
This listener gives you data and KPIs regarding the outcome of your load testing in a visual way. This allows you to analyze more efficitently your performance test and make it simpler for you to choose the next steps for your website or app.
- ULP Observability listener
Pre-requisites
The plugin requires the use of a Java version >= Java 11.
Installation
Via PluginsManager
- If you have not installed jmeter-plugins yet: get the jar from here
- put it in jmeter/lib/ext directory
- if you’re behind an enterprise proxy with (for example) the following configuration:proxyHost : my.proxy.server
- proxyPort : 8000
- proxyUser : user
- proxyPassword : pass
- use the following command to launch Apache JMeter :
- Linux/Mac :
JVM_ARGS="-Dhttps.proxyHost=my.proxy.server -Dhttps.proxyPort=8000 -Dhttp.proxyUser=user -Dhttp.proxyPass=pass" ${JMETER_HOME}\bin\jmeter - Windows :
set JVM_ARGS="-Dhttps.proxyHost=my.proxy.server -Dhttps.proxyPort=8000 -Dhttp.proxyUser=user -Dhttp.proxyPass=pass" && %JMETER_HOME%\jmeter.bat
- Linux/Mac :
- If you experiencing “Connection Timed Out” errors, you can set this property in the user.properties file:
jpgc.repo.timeout=120000 - Restart JMeter
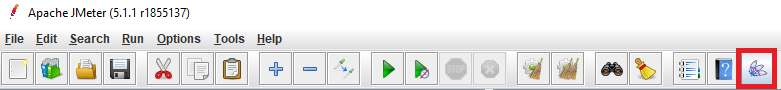
- In JMeter, open the plugin manager (icon on the far right)
- In the “Available Plugins” tab and in the search field enter the term “UbikLoadPack”
- Select the UbikLoadPack Observability Plugin
- Click the “Apply Changes and Restart JMeter” button
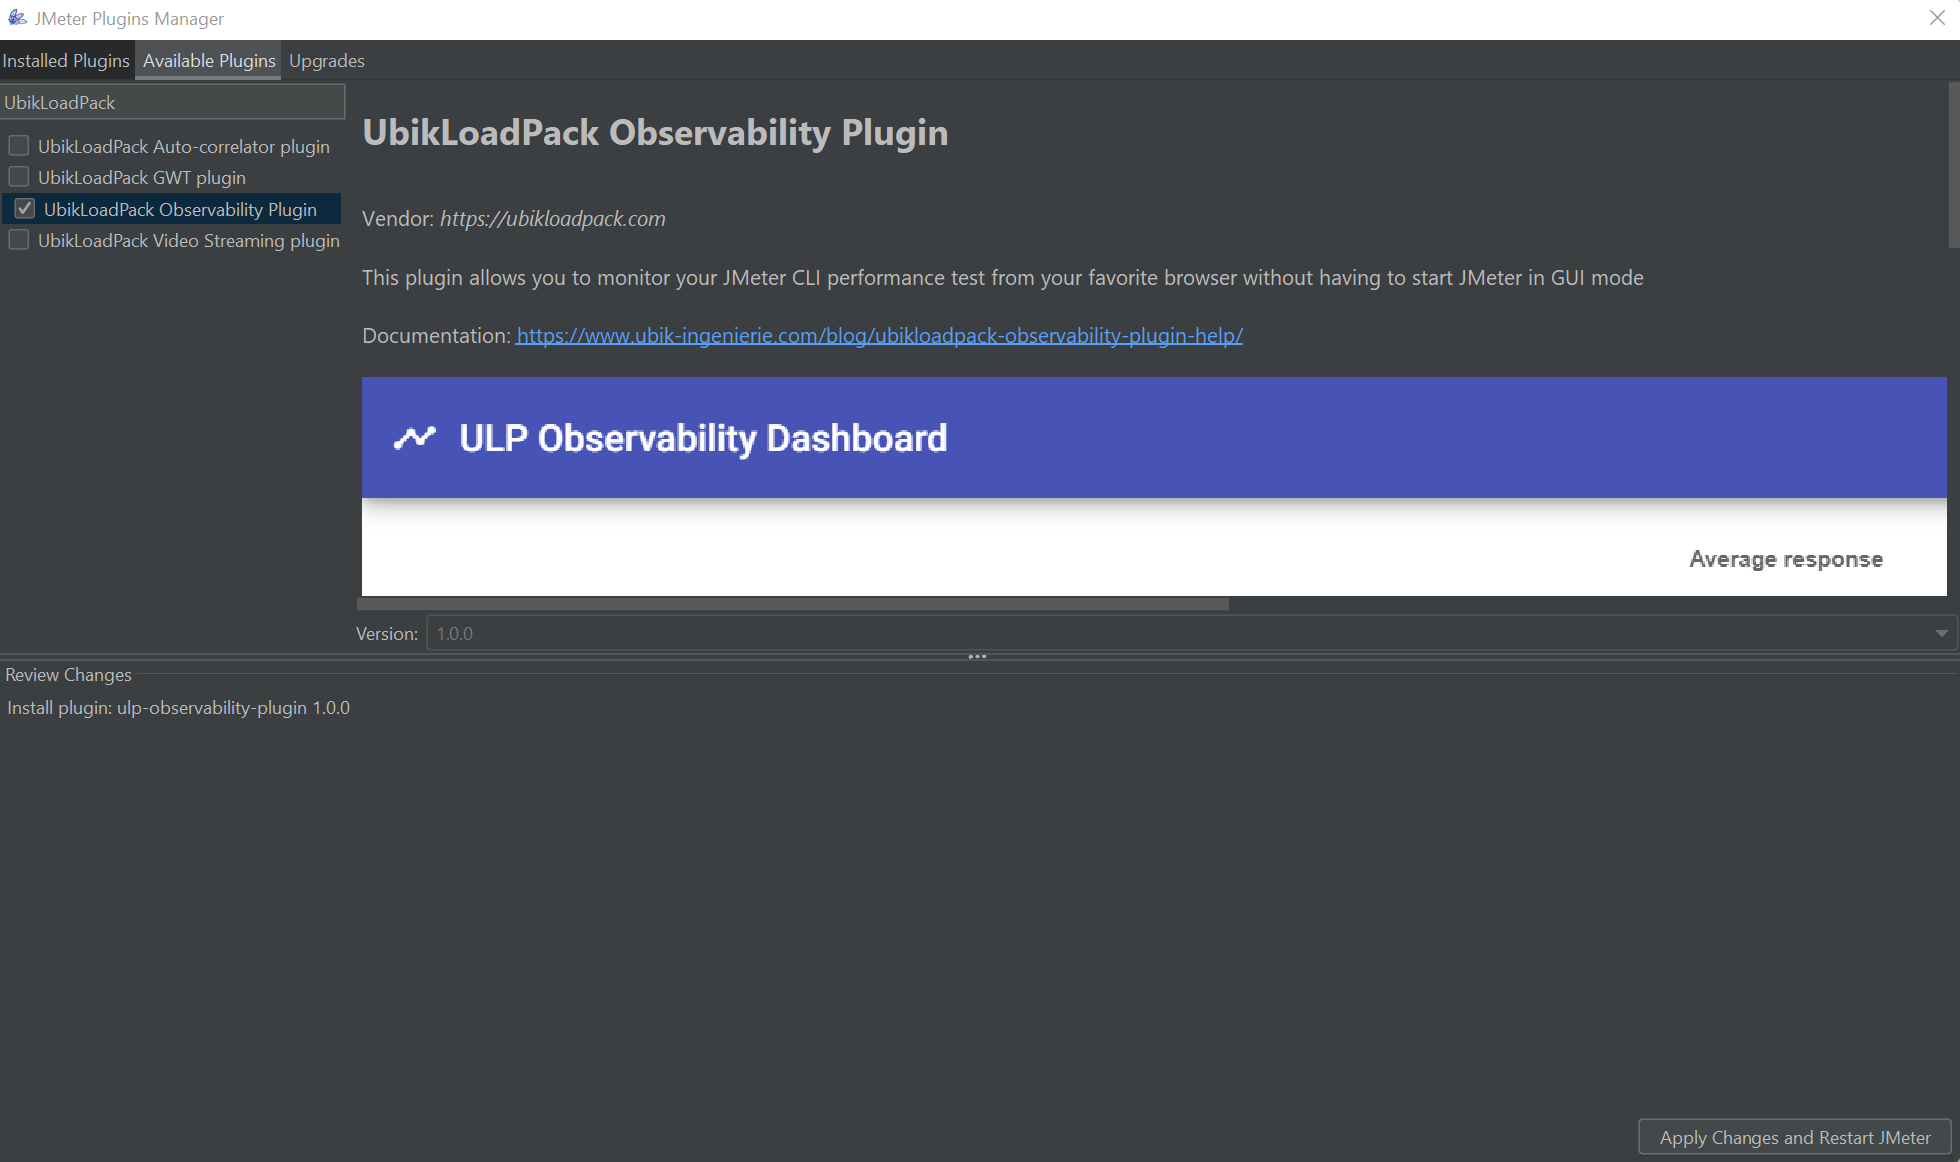
UbikLoadPack Observability plugin in JMeter Plugin Manager
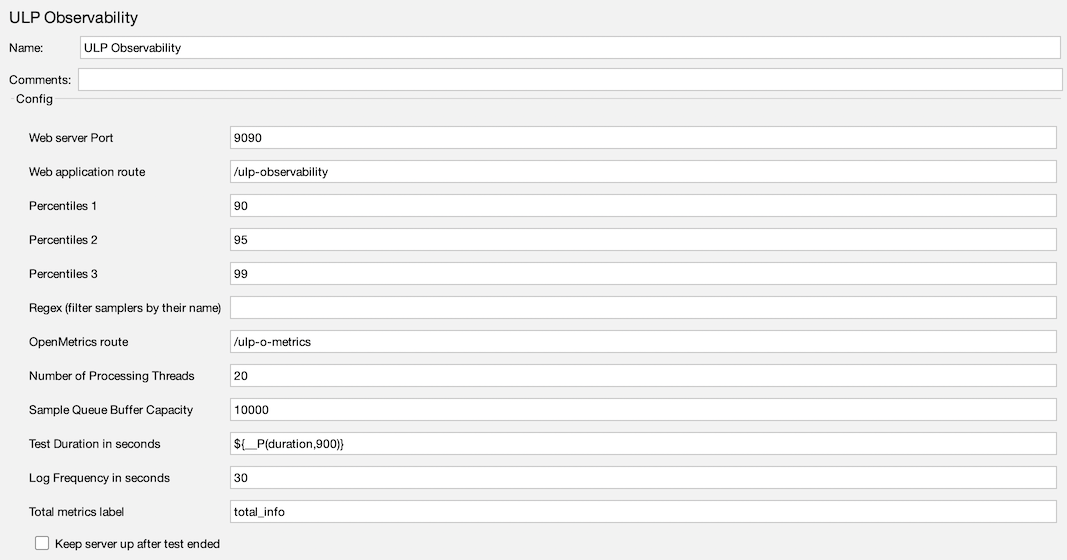
Plugin parameters :
- Web Server port : The port on which the plugin will expose the metrics, defaults to 9090
- Web Application route : Path to the web application exposing the GUI, by default : http://localhost:9090/ulp-observability
- Percentiles : 3 percentiles you can adjust to your needs to better evaluate your requests response time.
- Regex : Empty by default, which means that the plugin renderes every samplers. You can put a regex that try to match a sampler name. If it does, it renders the sampler. For instance, if in the above test we only want to display the group 2 samplers, we could put a regex which accept every name containing ‘group_2’ like this one : ‘.*group_2_http_request.*’
- OpenMetrics route : Path to the metrics endpoint, by default : http://localhost:9090/ulp-o-metrics
- Number of Processing Threads : Number of threads processing the SampleResults generated by your test requests. Do not confuse with JMeter thread which usually represent a “virtual user”. In this particular case, a thread is a literal “thread”. The more threads you have, the less likely you are to experience slowdowns in the queue processing. The more users and/or the more requests request rate is important, the more you need threads to consume the data in time.
- Sample Queue Buffer Capacity : Size of the queue containing the SamplerResults, this queue must be sized depending on your performance test throughput to avoid contention during the test. If you get array overflow errors, you should either increase this value, or increase the number of processing threads, or both.
- Test Duration in Seconds : This should be the duration of your test, it is useful to fill-in this value particularly if your test exceed 1 hour. This property is used for percentiles computation accuracy. It defaults to 1 hour.
- Log Frequency in seconds : Time between each test result refresh, after starting the test you need to wait for at least two actualization for the chart to be plotted. For instance if you set it to 10 seconds, you will have to wait 20 seconds before anything is rendered in the browser. Take care as your test must last at least 2x time this value if you want the plugin to be useful. This also controls logs refresh.
- Total metrics label : A label you can define to name the results summary of your test.
Plugin results :
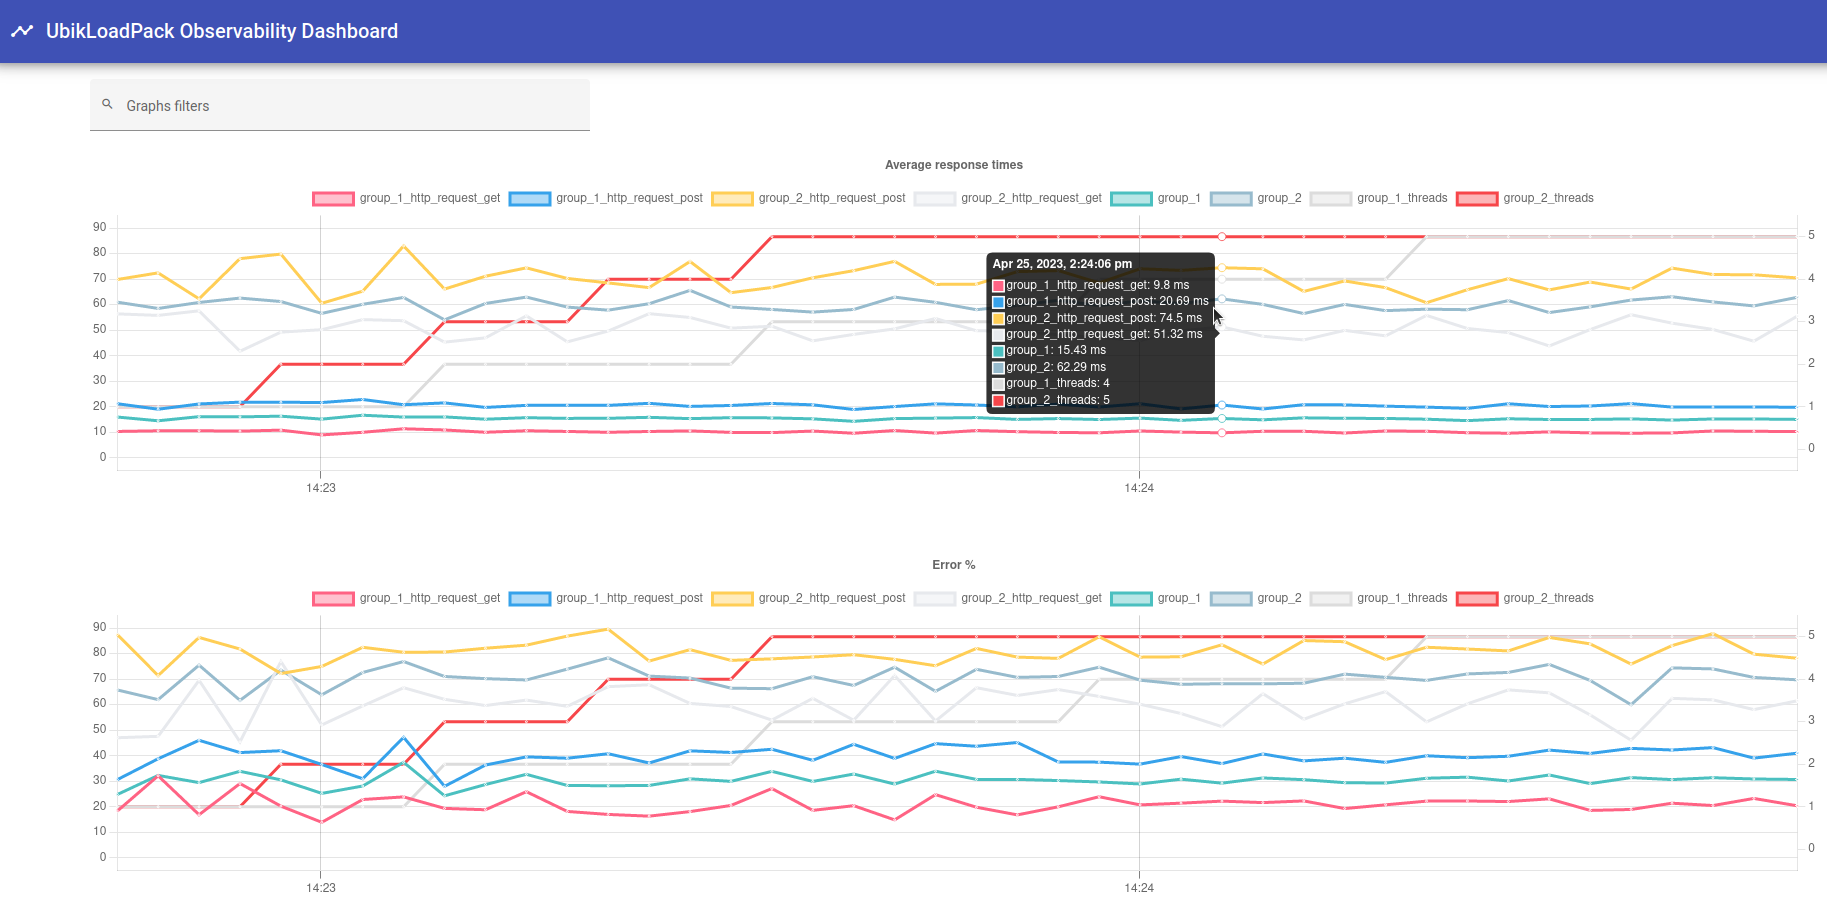
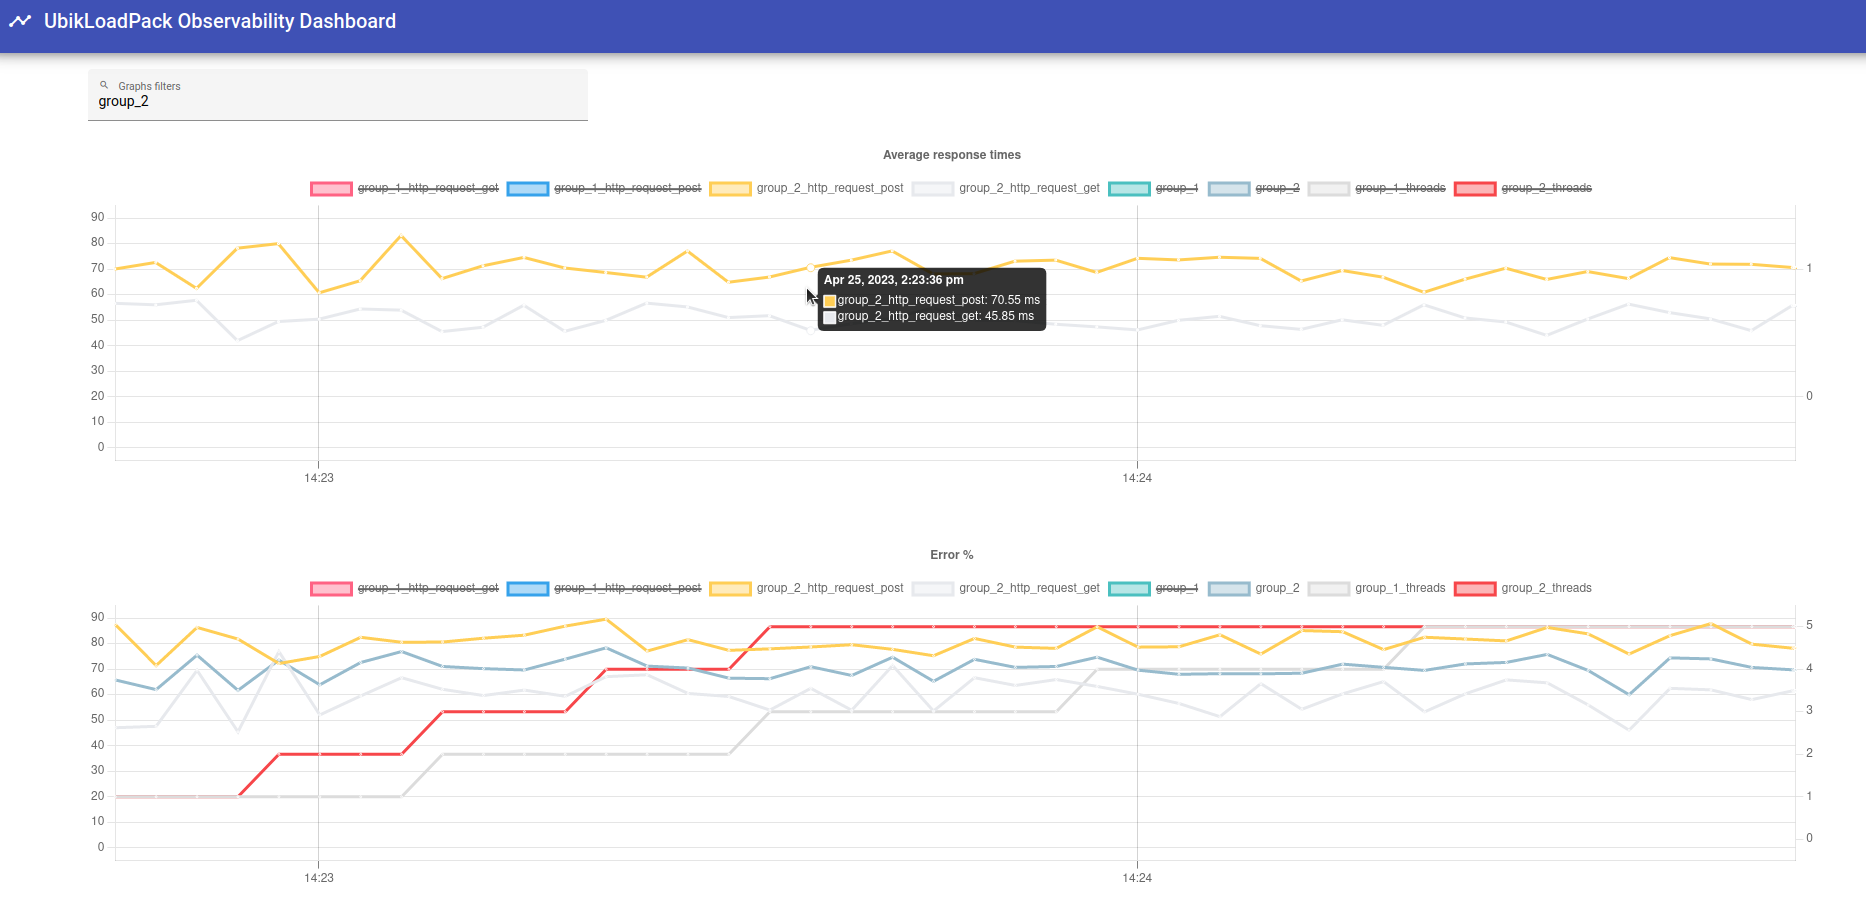
Example of a metric chart
- Left y-axis: metric of each group of samples
- Right y-axis: cumulative number of threads in each group of samples
- Graphs implemented for : average response, maximum response, percentiles, error percentage and throughput
If you feel like your graphs have too many lines, you can use the navbar at the top of the interface :
In the below example, we filtered the displayed lines thanks to the navbar and by clicking on some names at the top which enable/disable them.
Alternatively, you can use the regex parmeter presented earlier like this, and directly have the samplers you are interested in. This filtering is done on the server side and would also reduce resources used by JMeter.

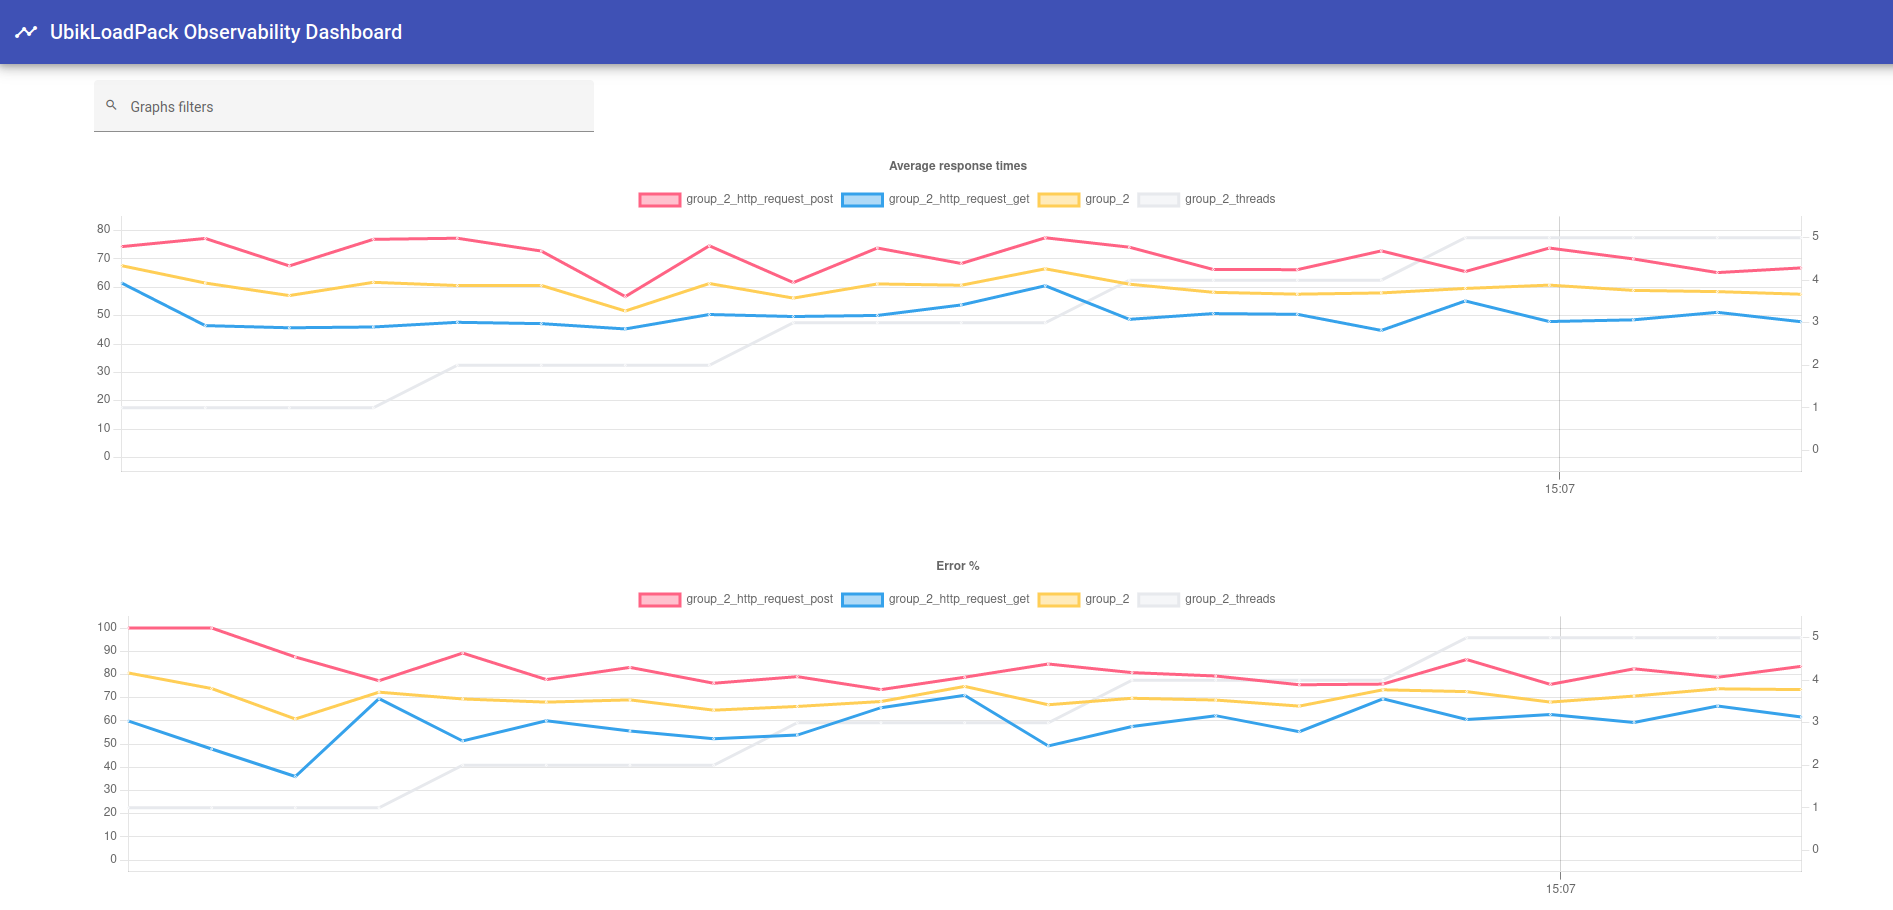
A good practice concerning the name of the samplers is to prefix their name with the group name. As such, if your group name is ‘group_2’, your samplers name should start with ‘group_2’. This way you can very easily filter them with the thread group name.
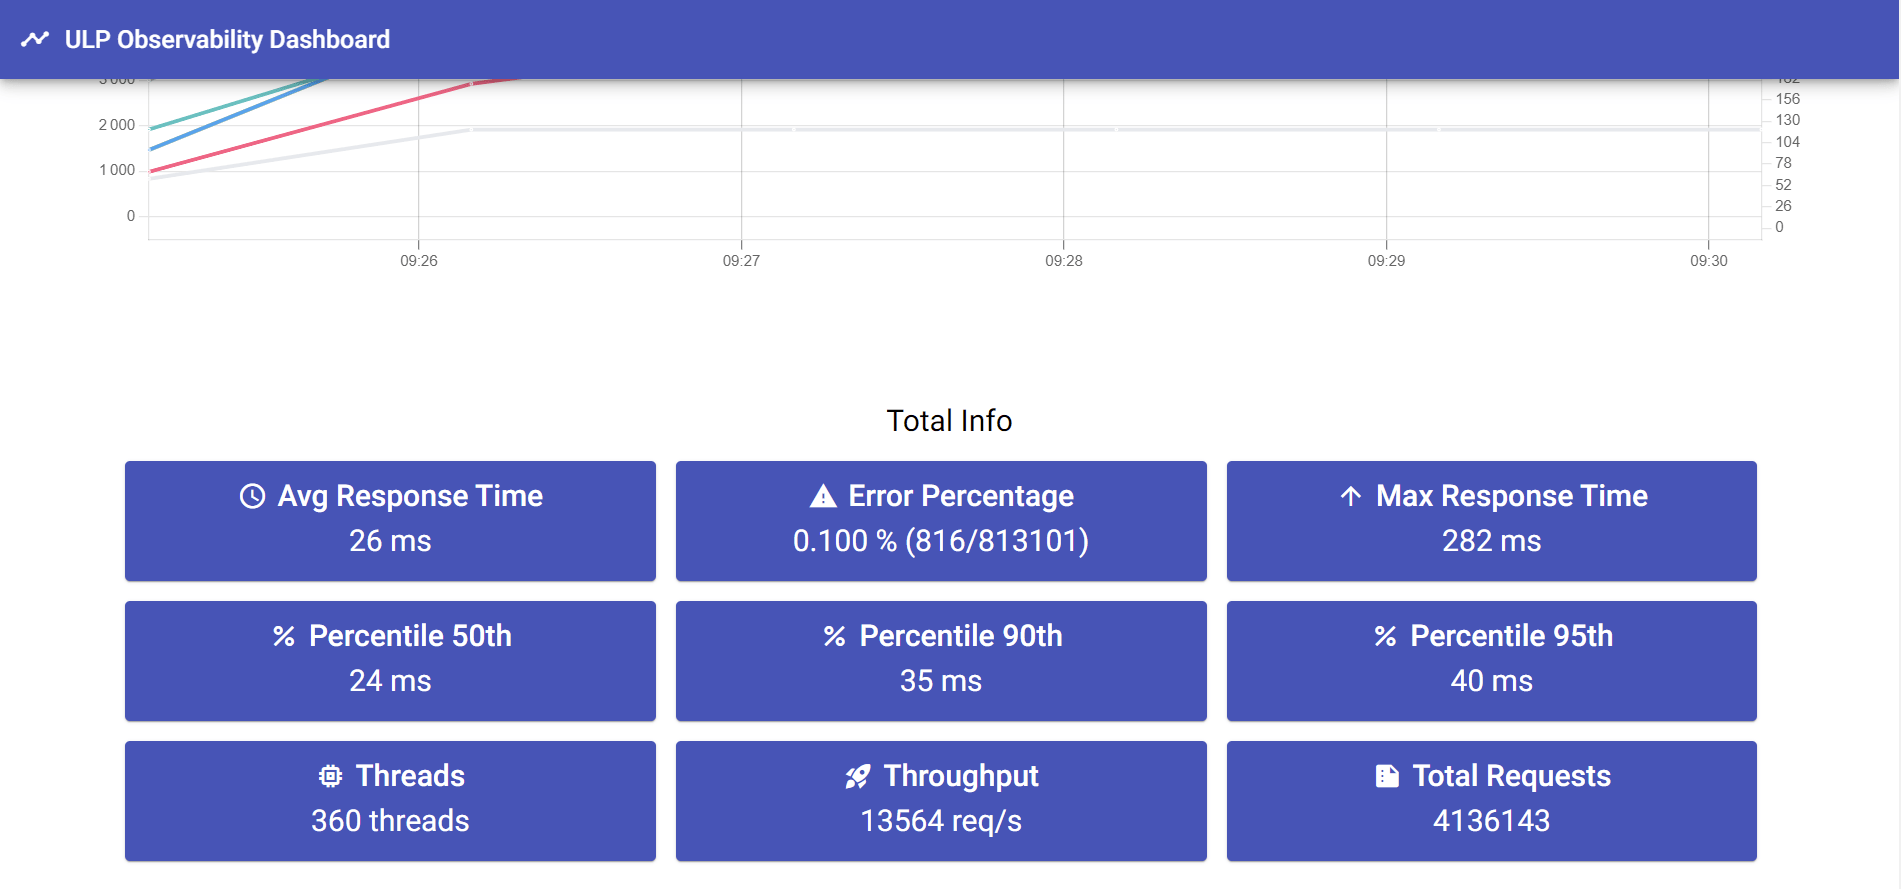
Example summary of total metrics
About us
- Ubik Load Pack is used by Big players in the Video streaming field
- We provide professional services for Load Testing
- Learn more about our streaming plugin
- Get a Free trial
UbikLoadPack solution

![]()

Publication
![]()
