
JMeter 3.1 is out with great new features:
6 months after the Major 3.0 release which brought a lot of new features, 3.1 has been released with another set of very nice features.
We’ll show you in this blog the most important ones.
JMeter 3.1 in few numbers:
Don’t be confused, 3.1 is not a minor version, with 58 enhancements and 35 bug fixes it is a major version that deserves consideration, and of course upgrading is highly advised.
We’ll see in this blog what features have been brought by Apache JMeter team and the 14 contributors who helped creating this awesome new version.
More precious graphs in the HTML Report:
We’re happy to see that the new HTML report that we donated to Apache JMeter in 3.0 has become very popular if you look at all stackoverflow questions and blogs that mention it.
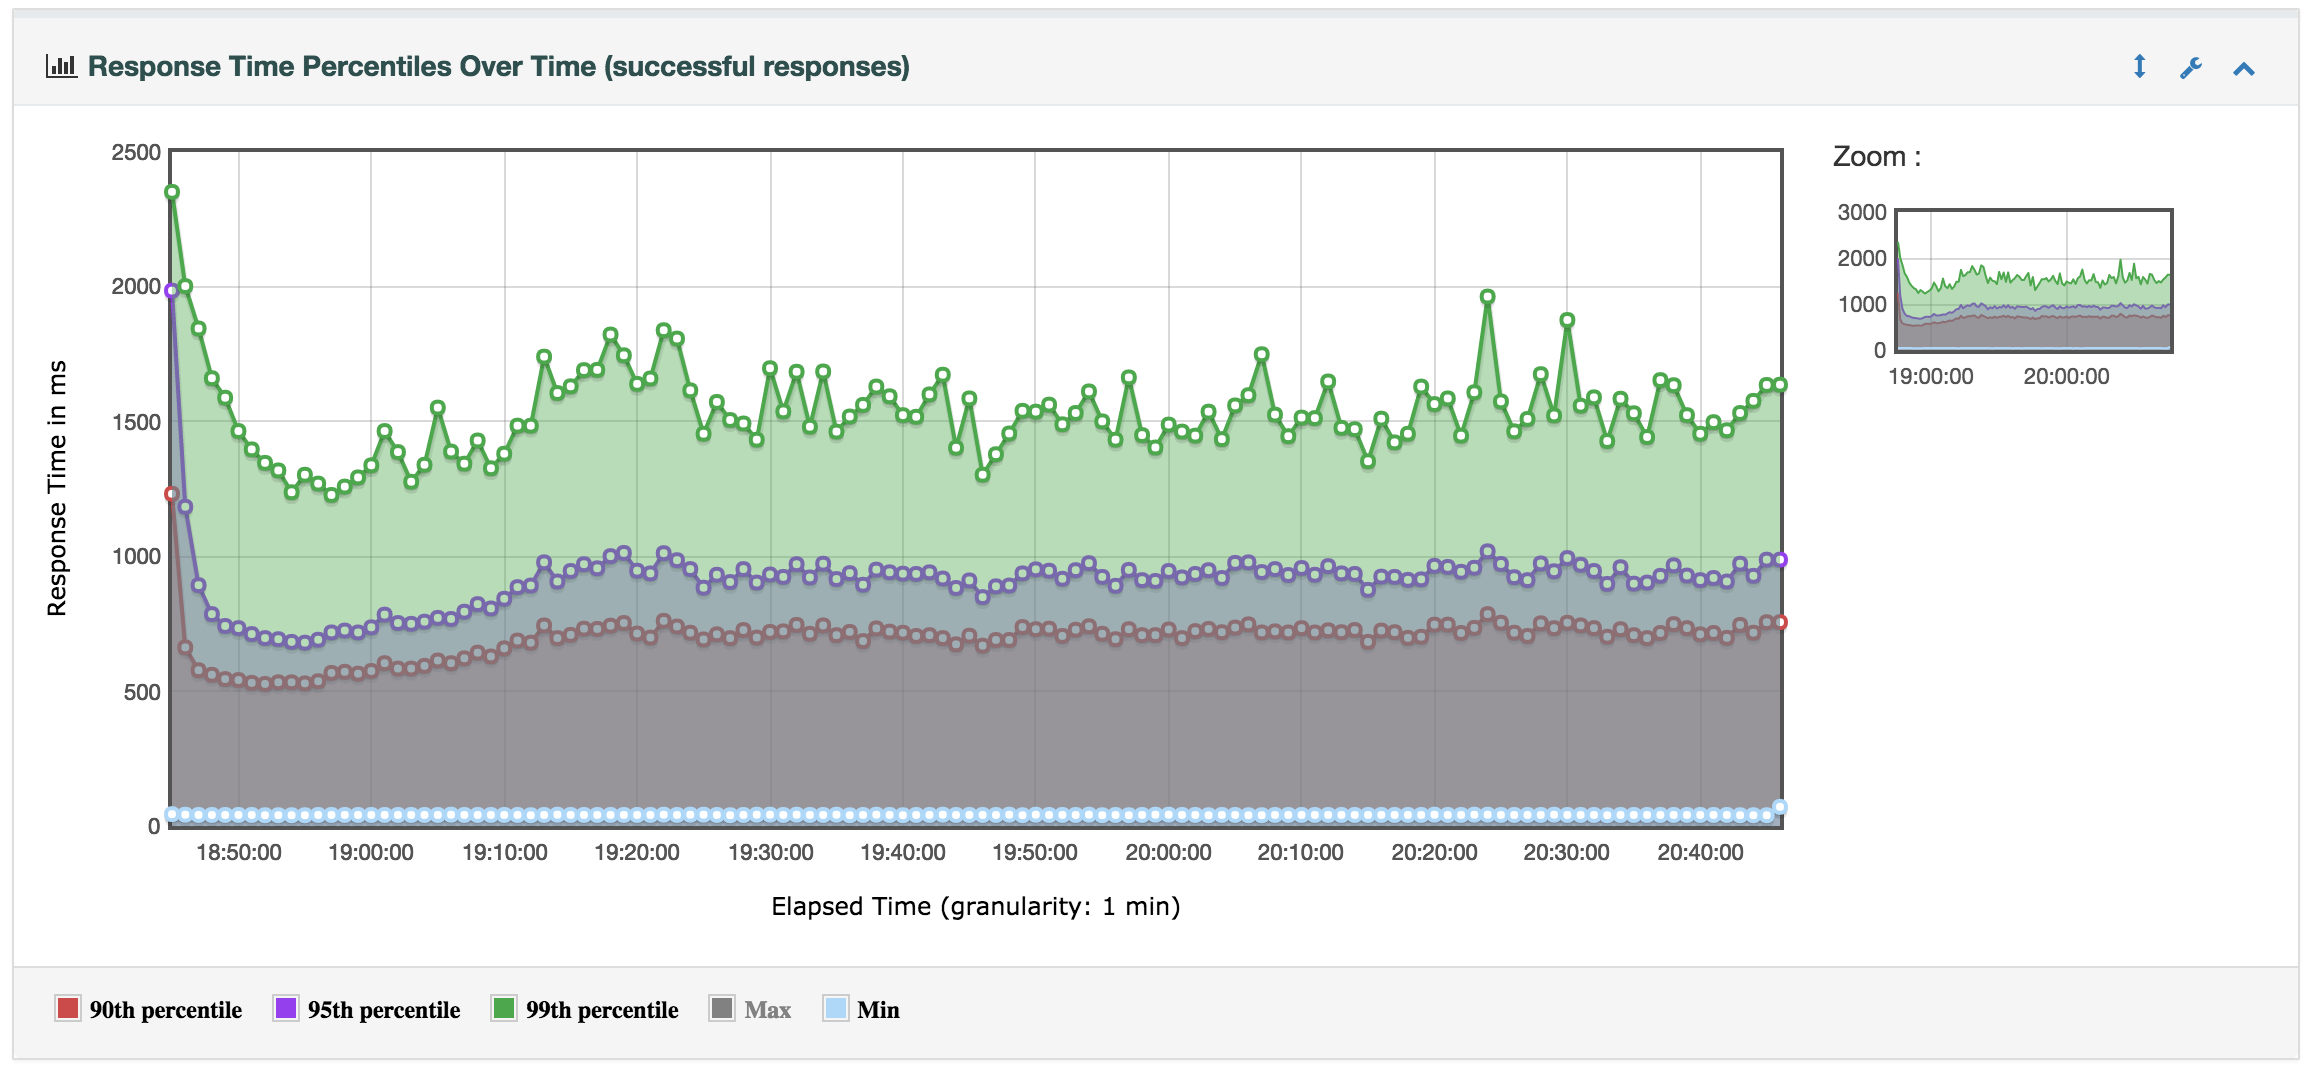
With 3.1, the JMeter team have continued improving it with some of our contributions and sponsoring by adding 3 new Graphs:
Response Time Percentiles Over Time (successful responses) graph:
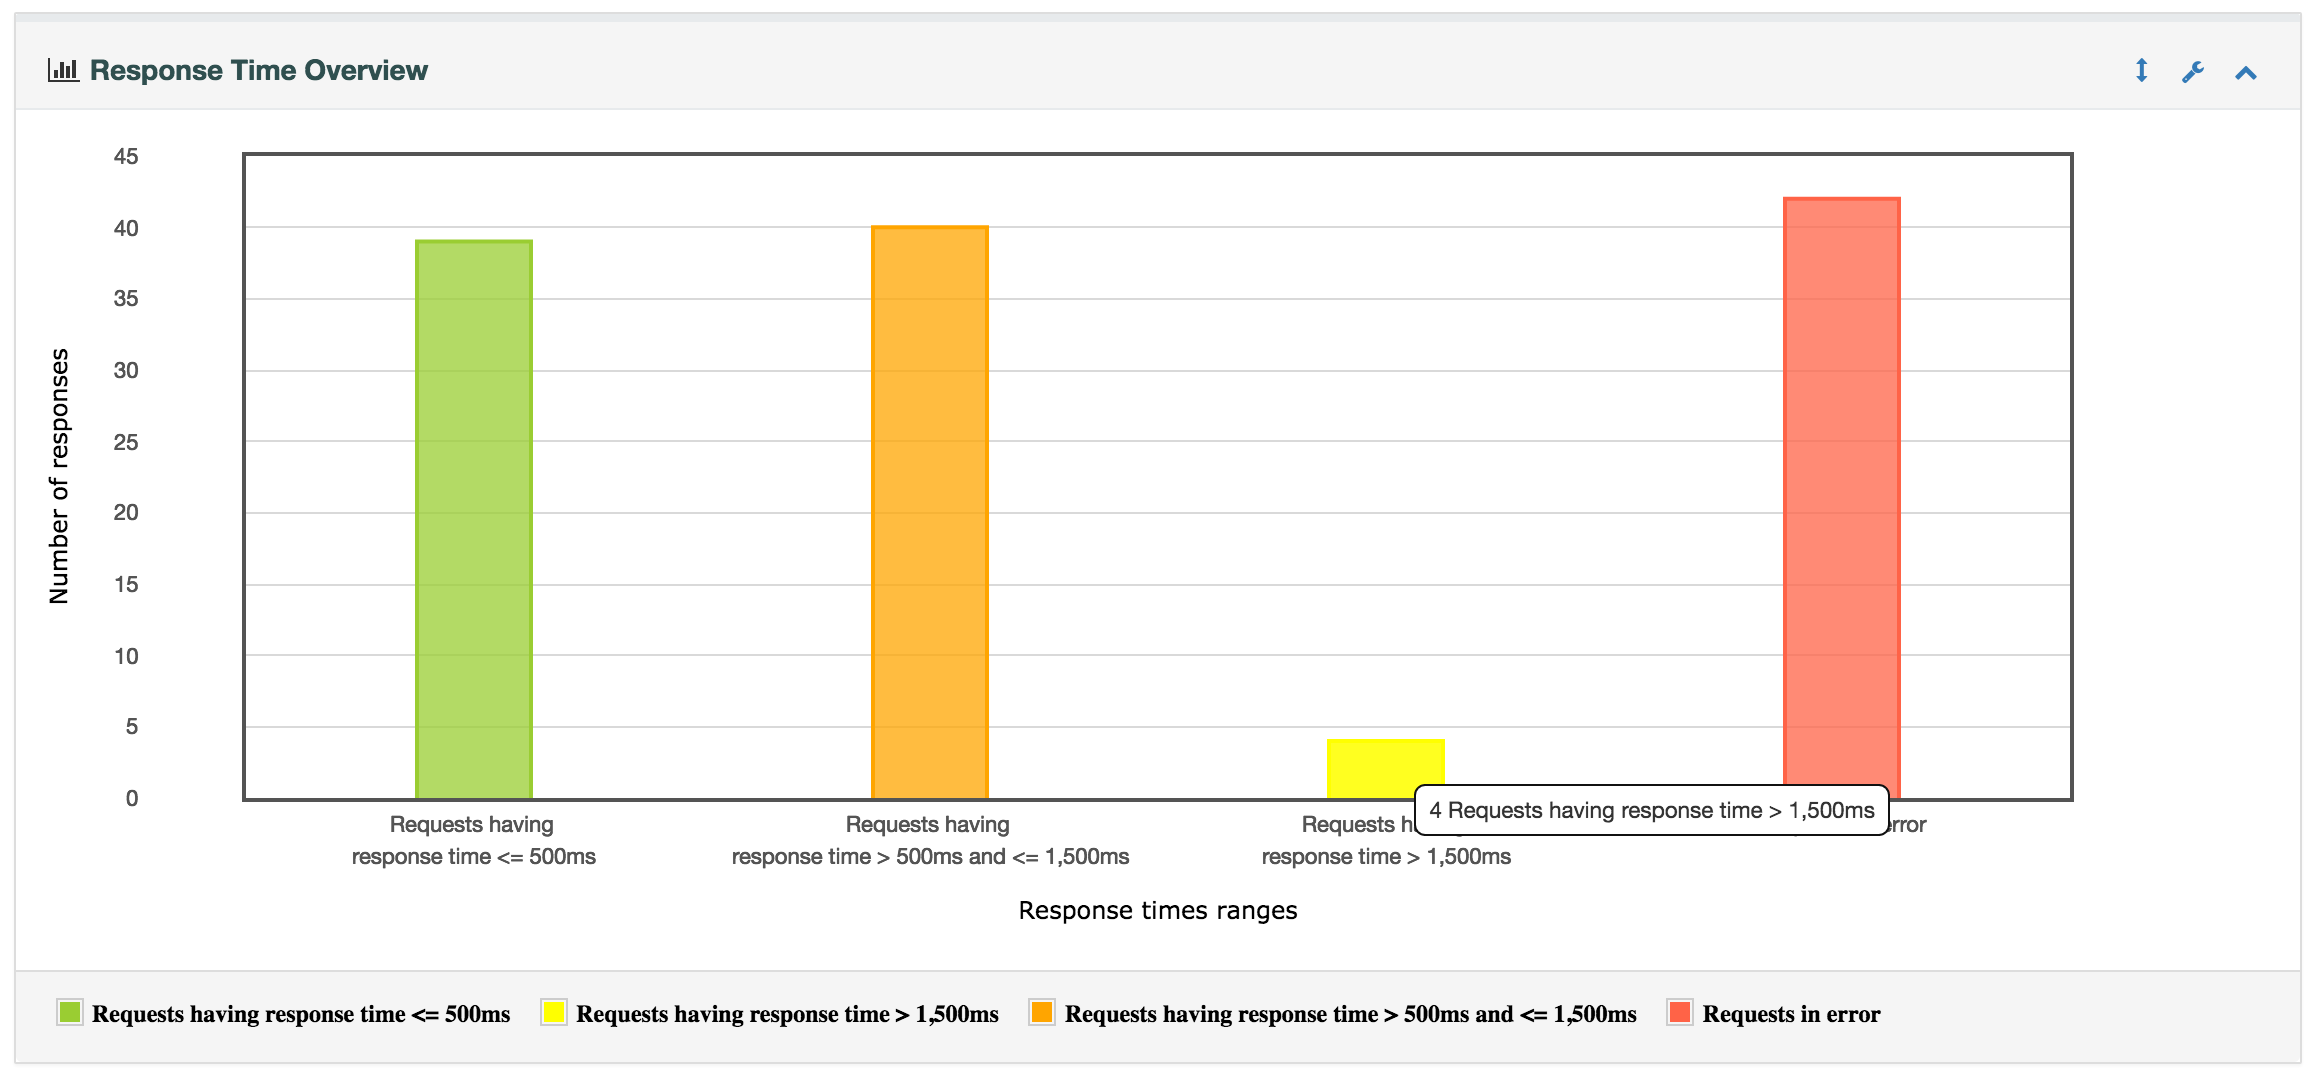
Response Time Overview graph :
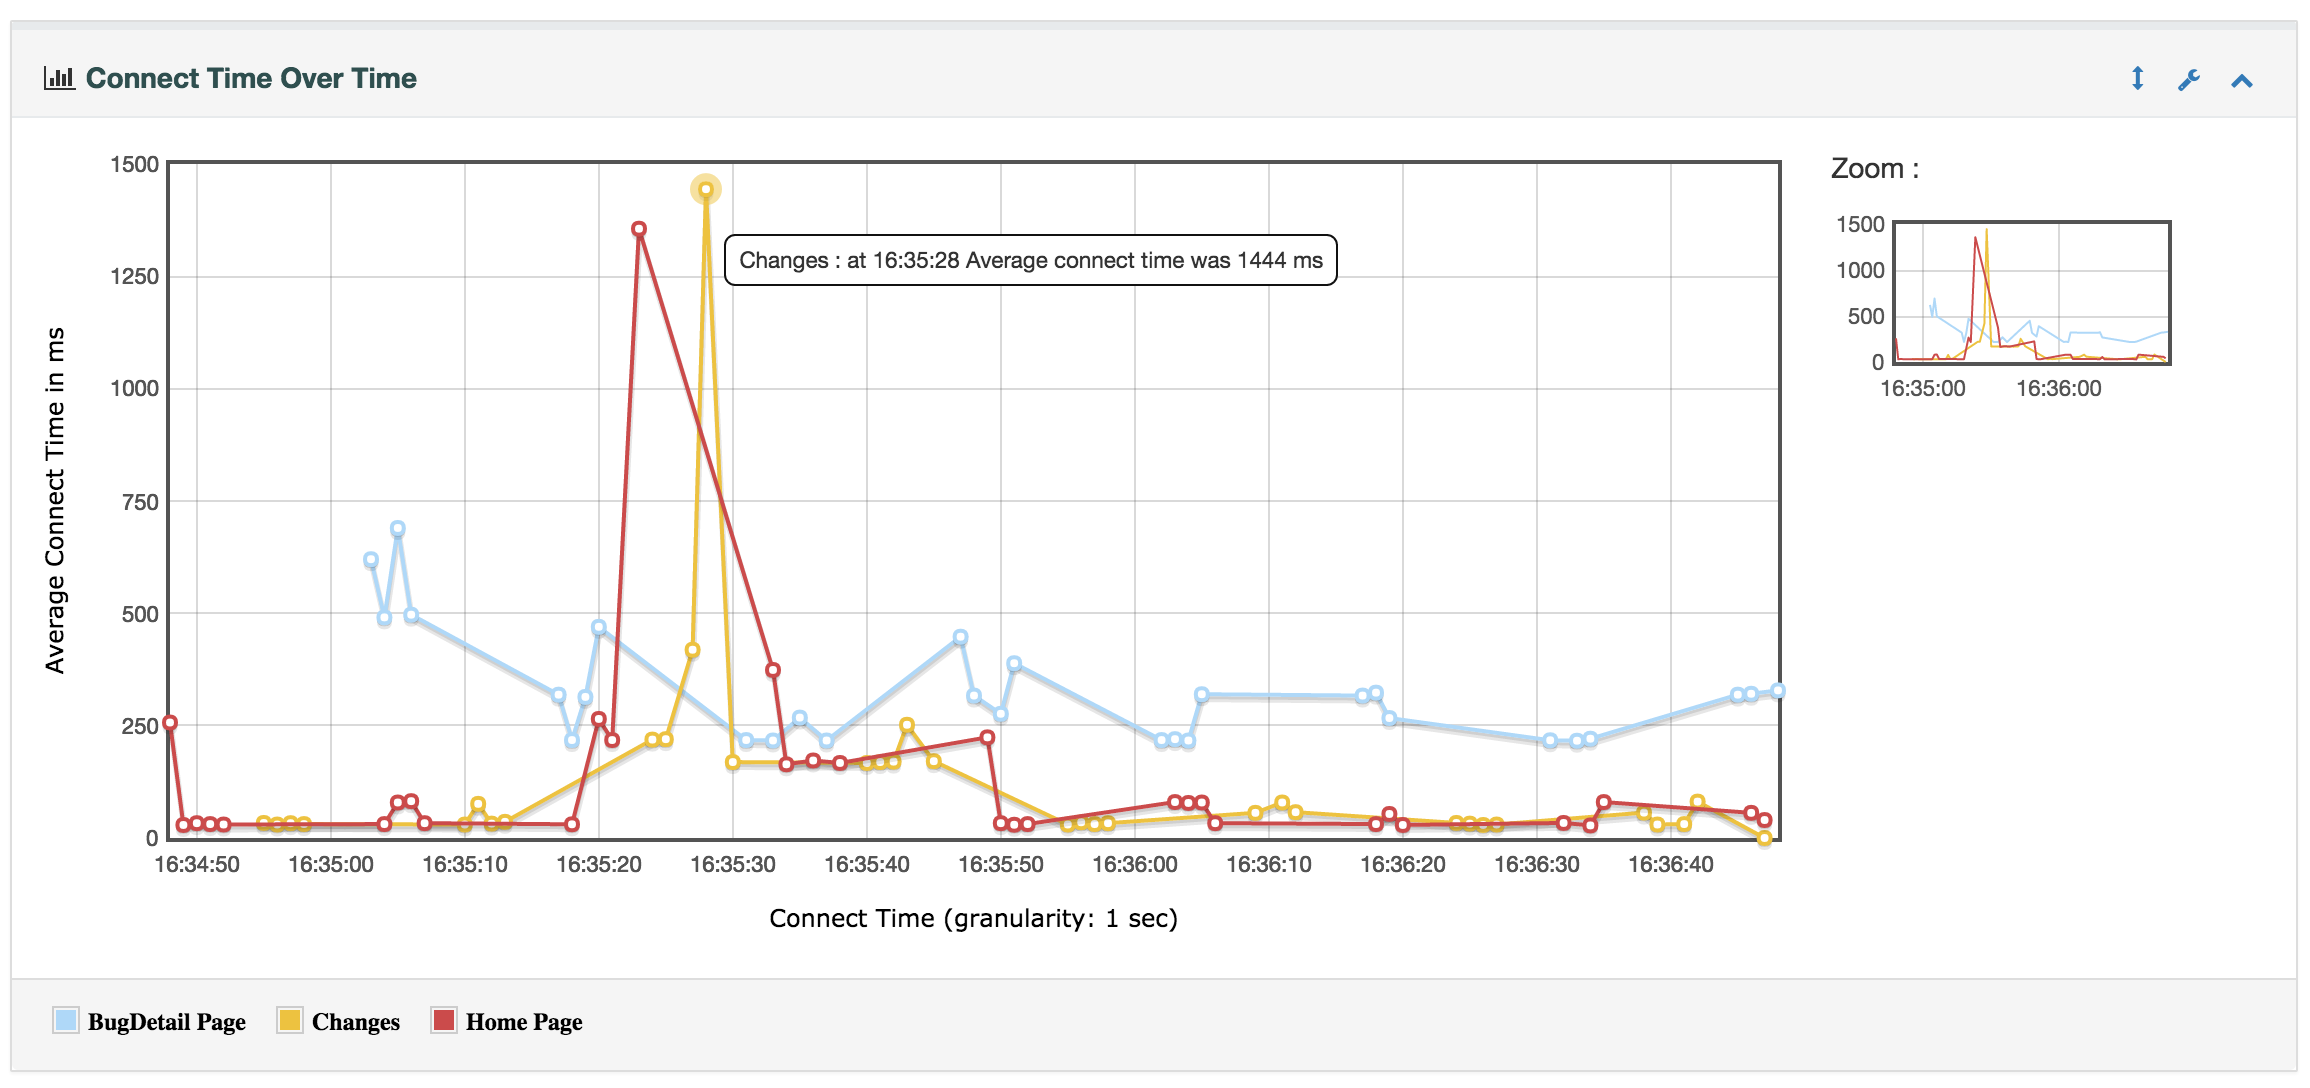
Connection Time over Time:
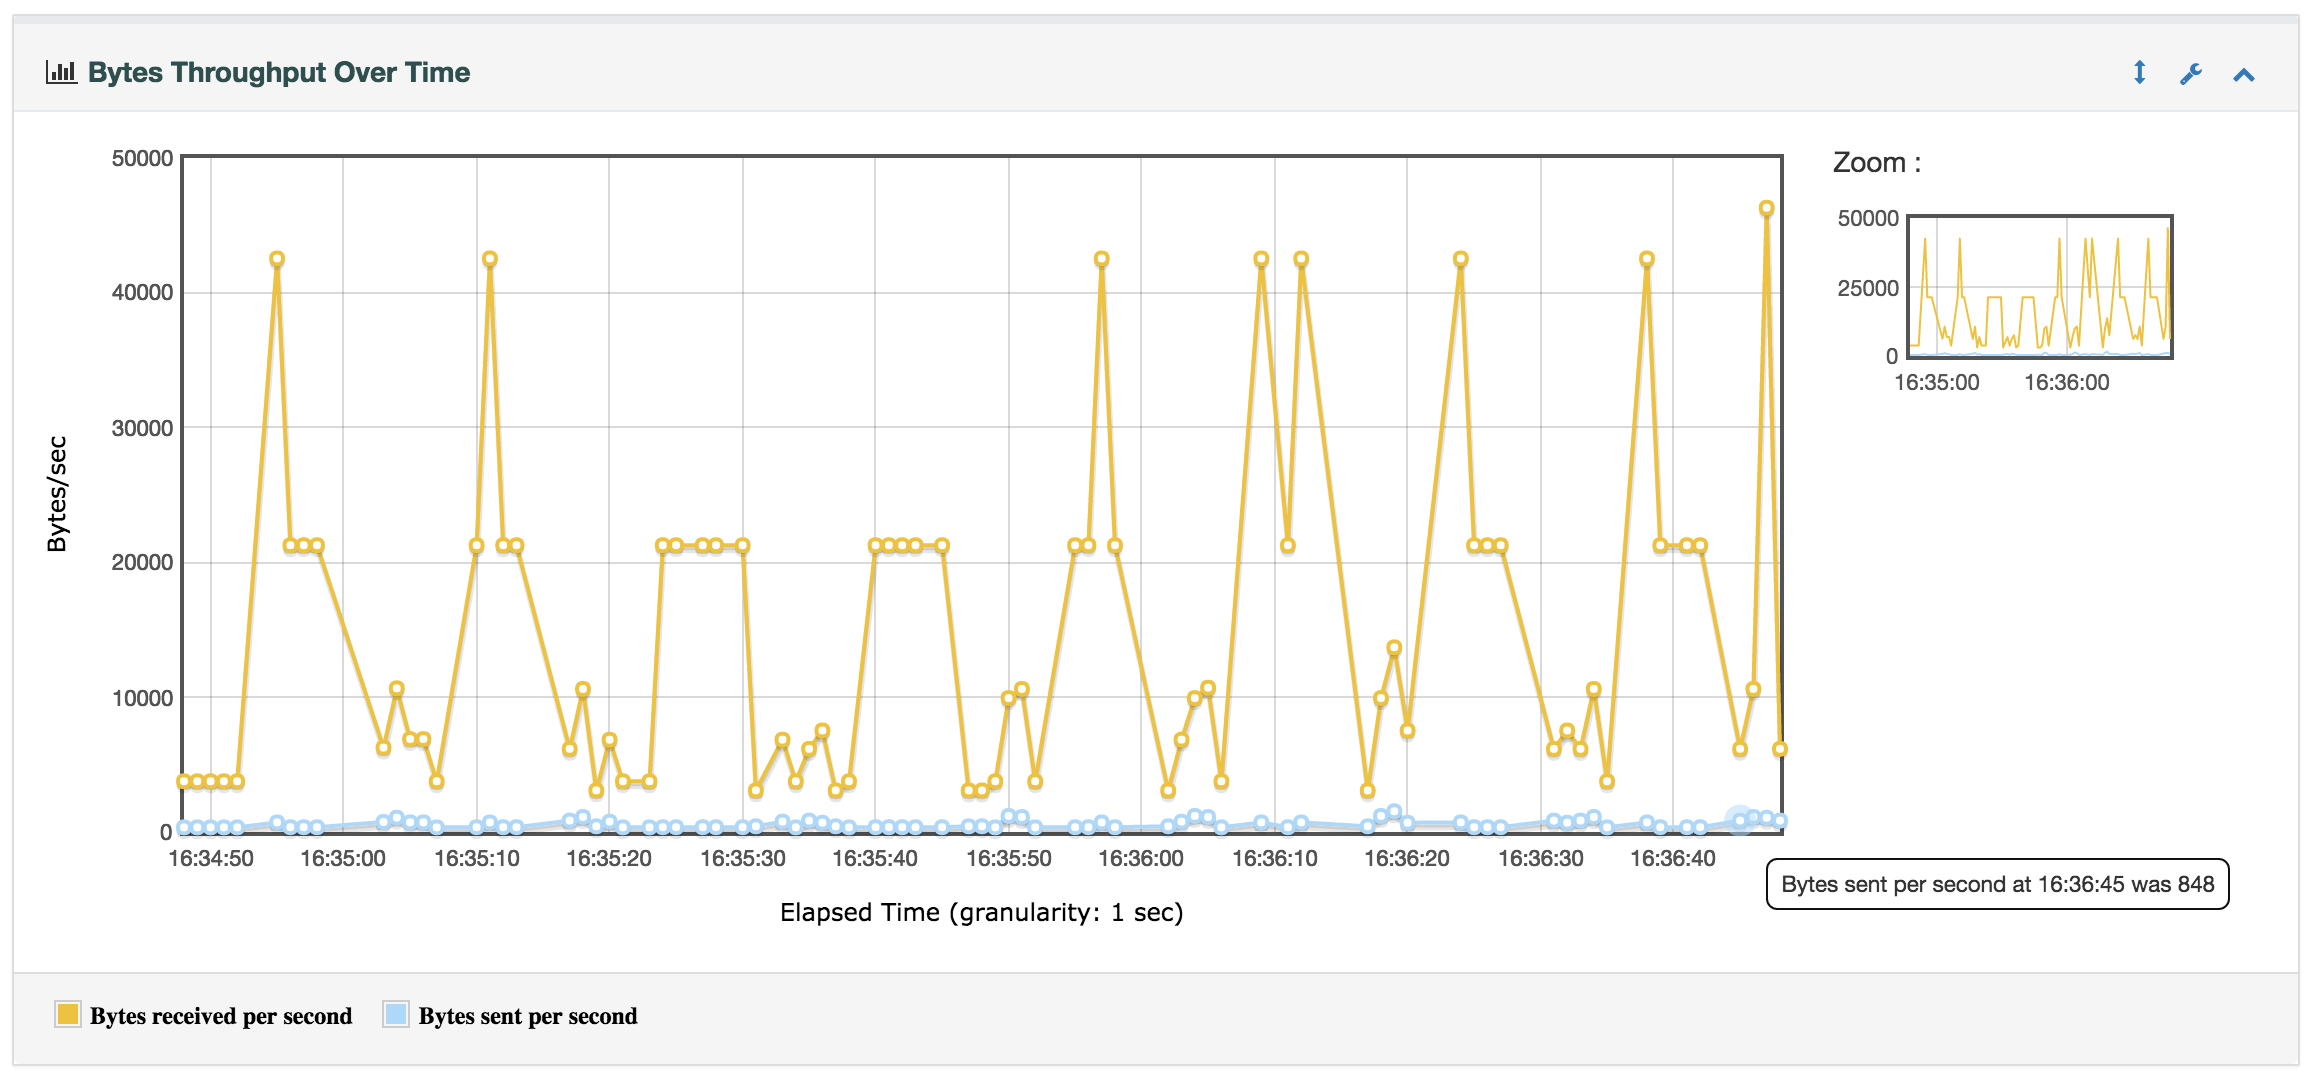
By improving Bytes Throughput Over Time with addition of Sent Bytes metrics:
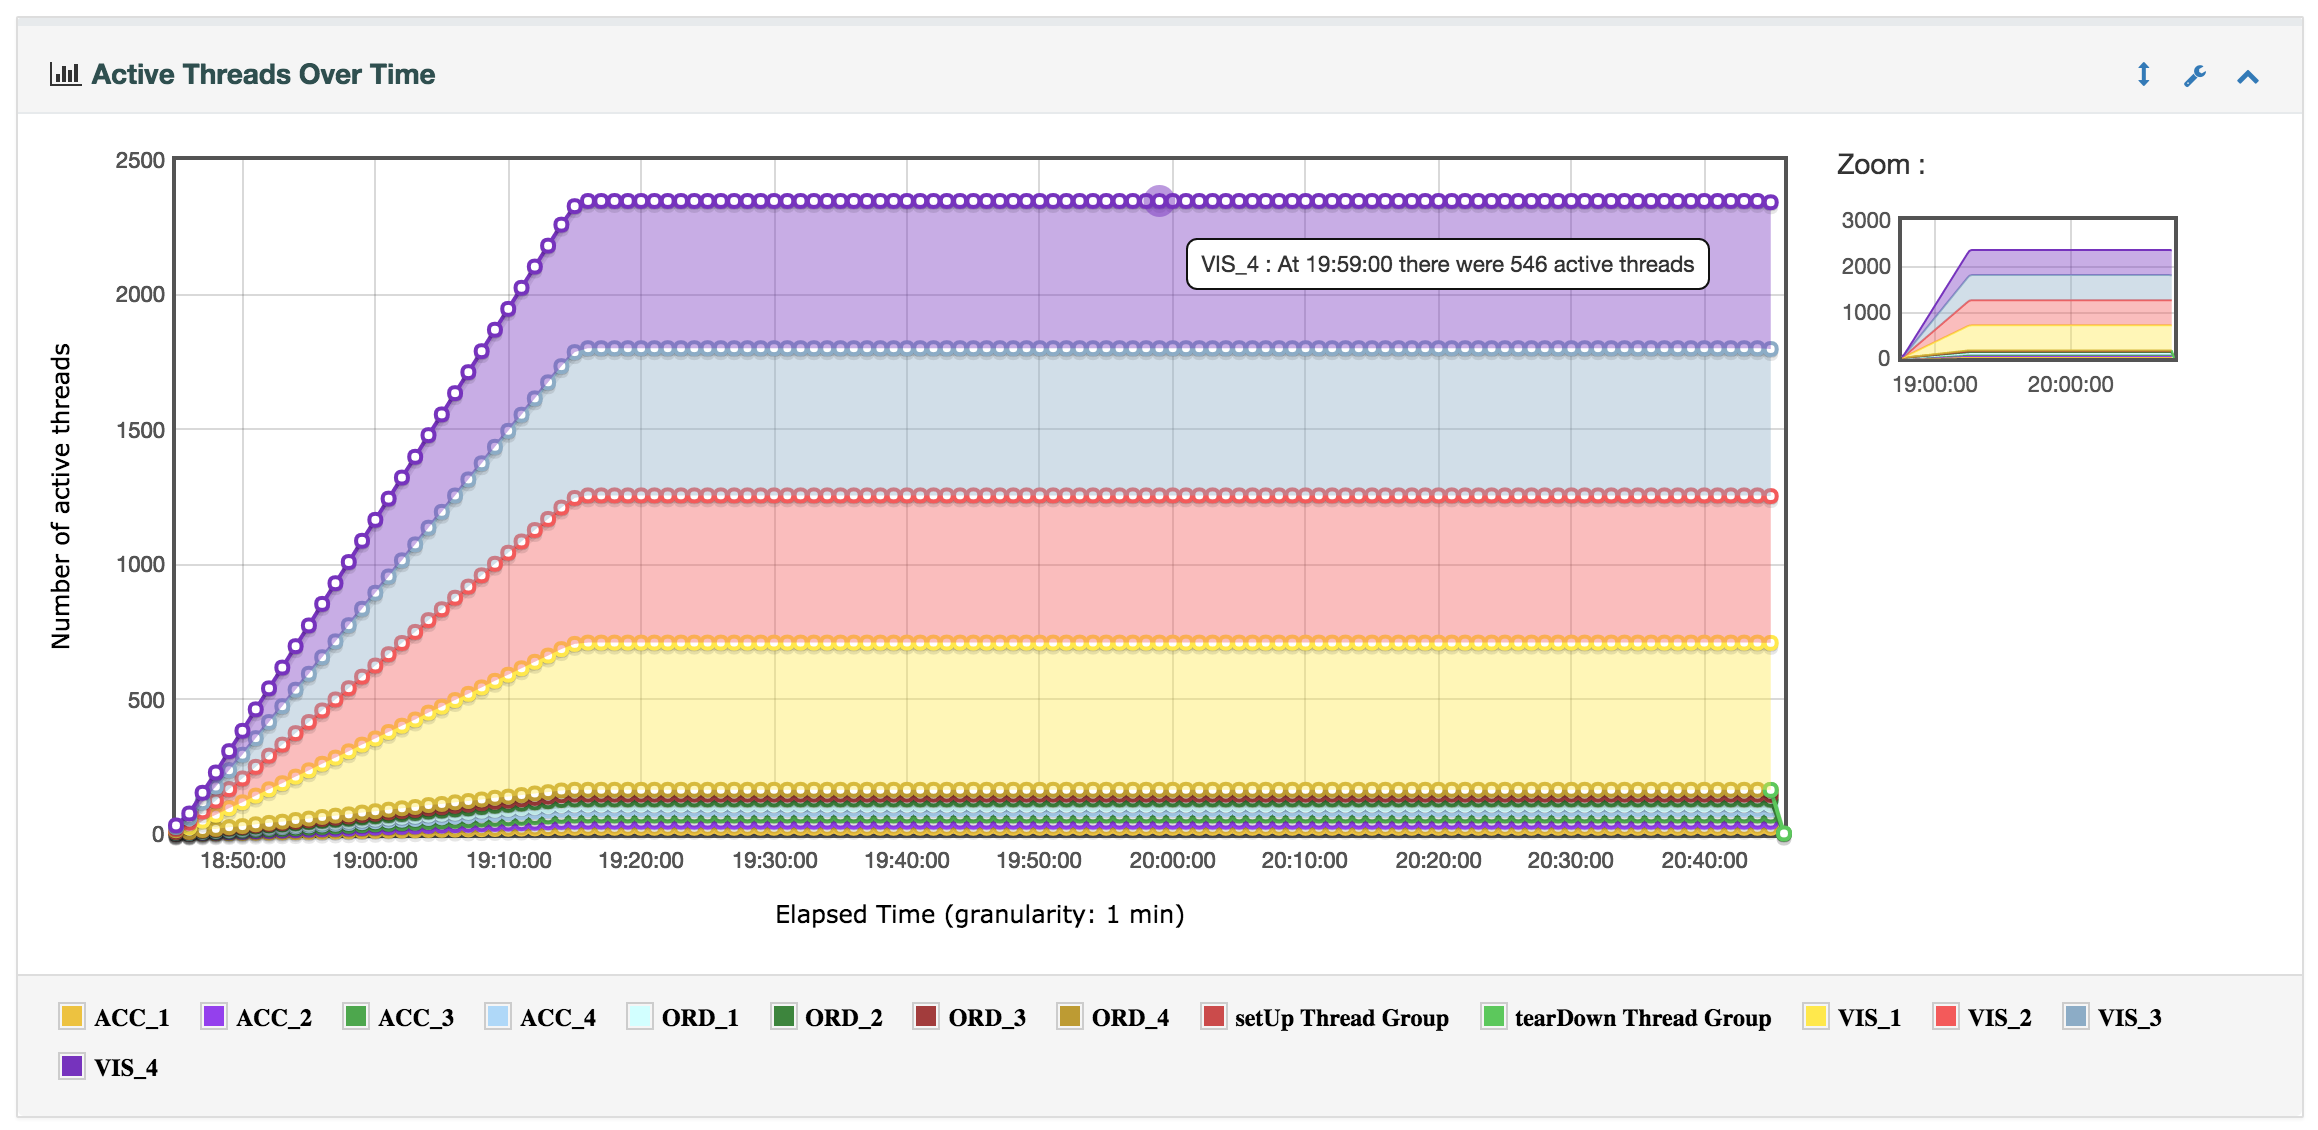
By stacking Threads when doing distributed testing which give a much understandable view of threads :
Better error analysis in the HTML Report:
The HTML report has also been enhanced with the addition of a Top 5 Errors by sampler:
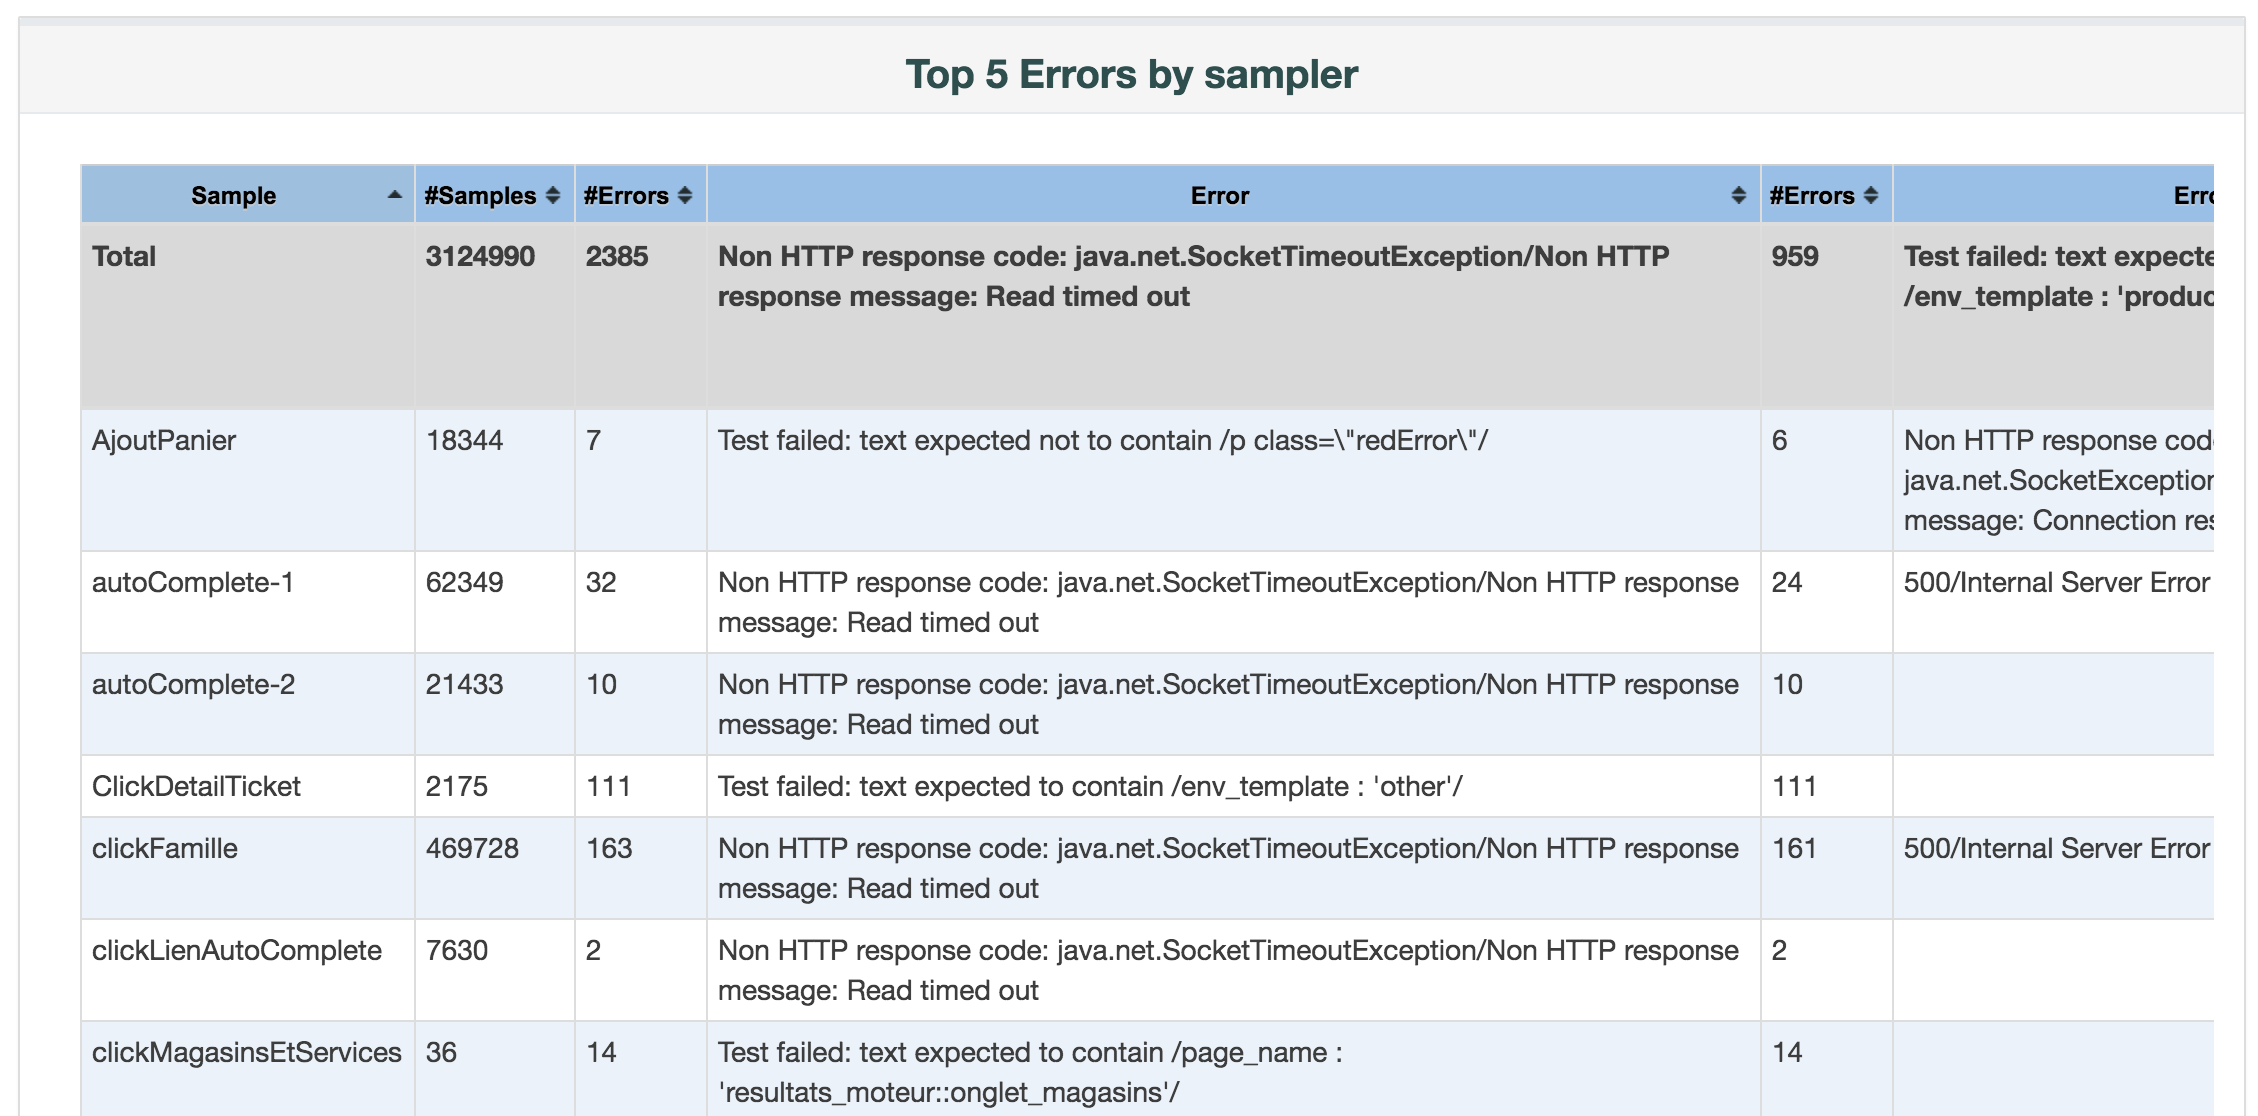
With this table, you gain huge productivity in Load Test analysis.
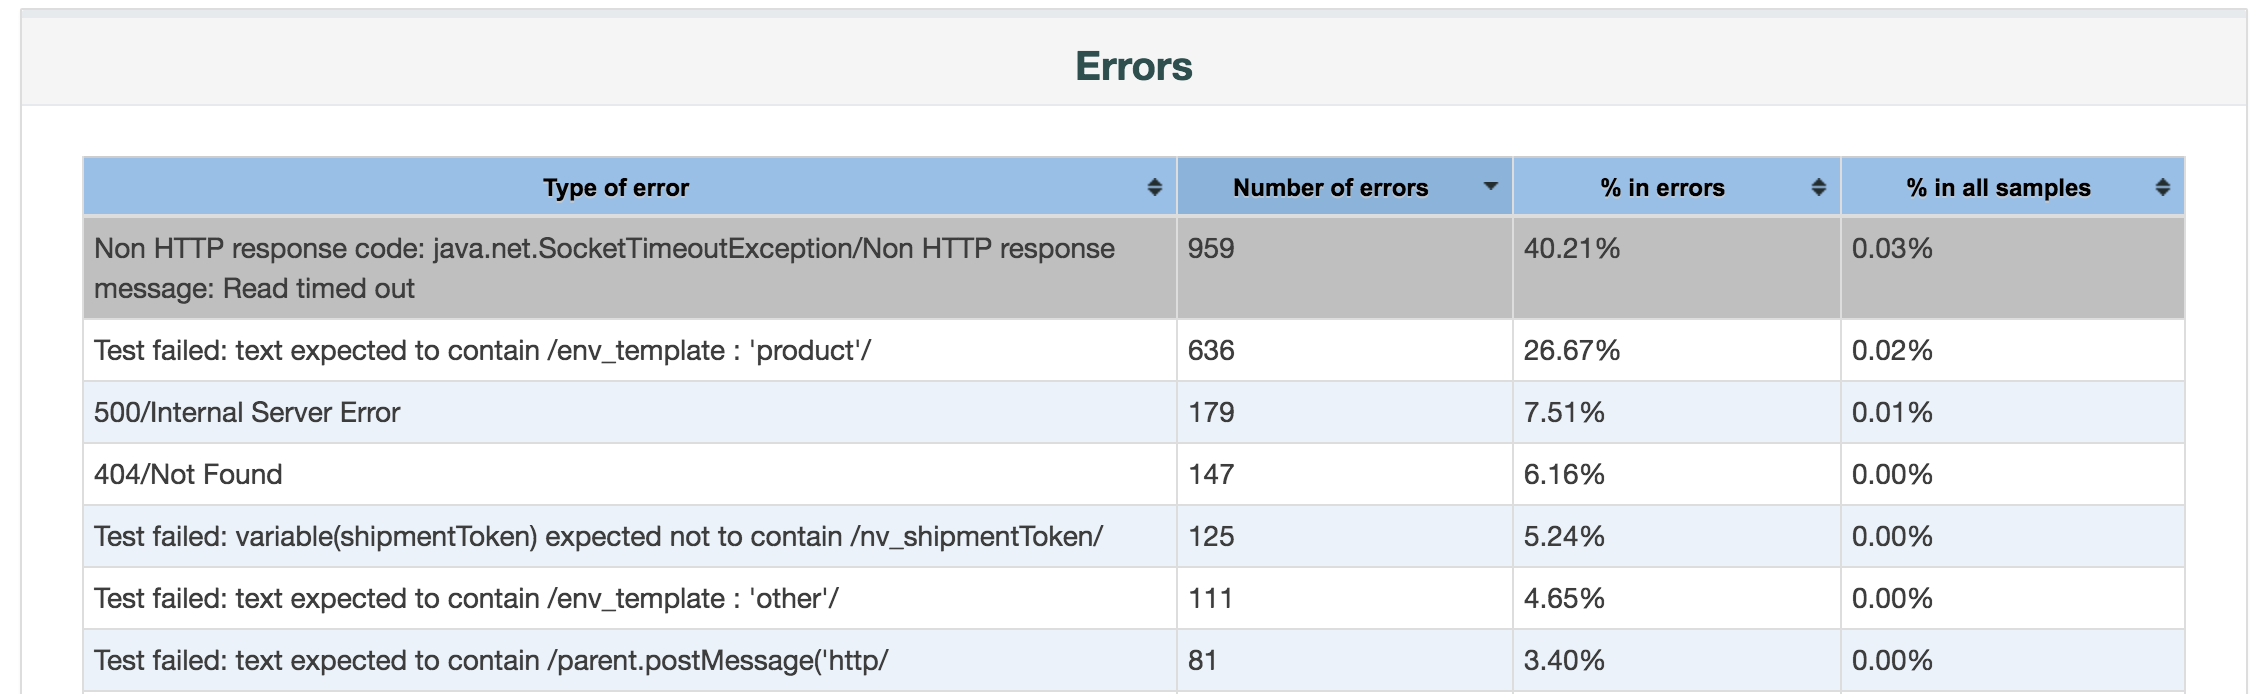
And more details in the Errors Table:
New Metrics:
With JMeter 2.13, “connect_time” metric had been introduced, it provides the time taken to establish the connection with the target server. 3.0 improved the accuracy of this metric.
Since 3.1, it is now enabled by default and as you’ve seen it above, it is graphed accross time in a dedicated graph.
Another very interesting metric has also been introduced in this version, which is the “sent_bytes” metric. This metric is very interesting when you have tests that send a lot of data to the server, like upload scenarios for example. This metric is also available in the graph “Bytes Throughput Over Time” of the HTML report
Groovy is your new friend:
With version 3.0, Groovy had been embedded in JMeter to ease its setup and encourage users to use it.
With this version, a new Function __groovy function has been introduced.
It gives you the ability to evaluate any Groovy expression like you can currently do it with __Beanshell function but:
- with the full power of Groovy and Java 8
- without the performance drawback of Beanshell
Besides, when you use JSR223 Test elements, by default JMeter will set Groovy as the language. Note that we advise you to check “Cache compiled script if available” checkbox for most optimal performances.
As a summary, you don’t have any excuse left to still use the now old and slow Beanshell with JMeter 3.1.
Better think time experience:
You can with this new version apply a multiplication factor on most commonly used timers (Gaussian, Uniform Random and Poisson Timer). This allows you with 1 property change (timer.factor=1.0f) to play with your test throughput from one place gaining huge productivity.
Handle big responses:
Due to internals choice of Integer for storing bytes value, JMeter could only report correctly response sizes below 2g. This limit has been increased to 9223372 TB.
Besides, to handle such big responses, it can also now truncate part of the response to avoid over-flooding memory. See httpsampler.max_bytes_to_store_per_request property.
Various Improvements that make our lives easier
It is also very interesting to see that the core keeps improving with enhancements in many fields:
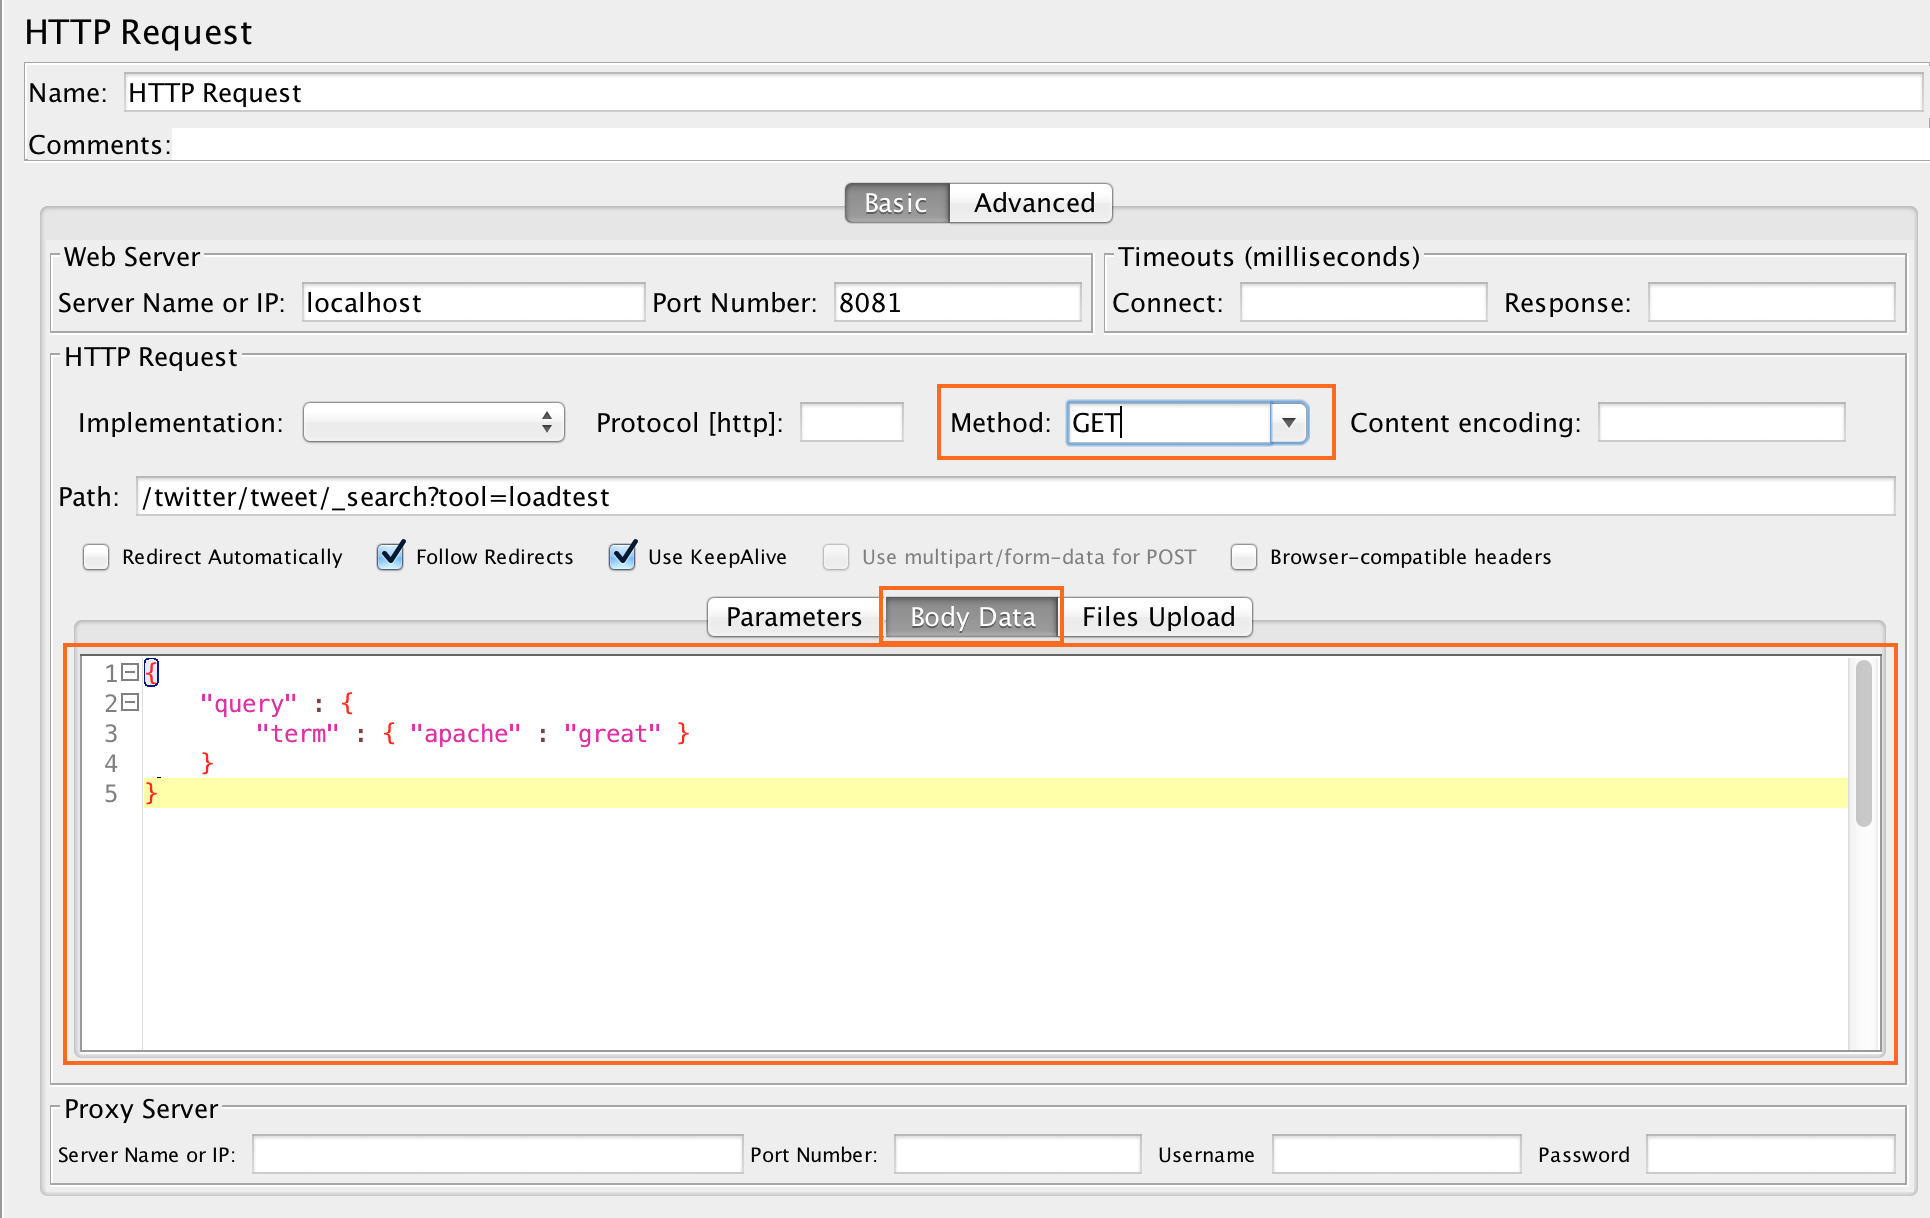
- Restful applications have never been so easy to test since now JMeter allows you to use the “Body data” content even for GET request.
- Documentation has been improved with a new reference page for properties , a full review of User Manual to ease beginners learning curve and show clearly all features of Apache JMeter
- Lot of UX improvements that make GUI experience much nicer (Clipboard copy in assertions, multiple selection/deletion in HeaderManager…)
- Improvements to the JSON Extractor that we contributed in 3.0 version
- A new HTML viewer that shows clean and formatted html for easier extraction
- More meaningful error messages to ease configuration and error diagnostic in CSV DataSet
- Improvements in memory management
- Dependencies upgrades with major performance improvements in the critical JSoup library used by JMeter. We’re happy at Ubik-Ingenierie to have contributed to some of JSoup performance improvements.
NDLR
As you can see, JMeter continues to innovate and improve in all fields thanks to the work of its core committers, a growing community of contributors and users, and a lot of commercial and Cloud solutions built around it.
So download it and start playing.
And if you need training, support or third party plugins, contact us.
About author:
Philippe Mouawad works as an Architect and technical expert for Ubik-Ingenierie where he leads among other things the development of UbikLoadPack a set of Commercial Plugins for Apache JMeter allowing to load test different protocols like HLS, GWT, Flex.
Philippe is a committer on the Apache JMeter project and member of the PMC since October 2011.
Finally he is a co-author of a french book on JMeter called Maîriser JMeter: Du test de charge à Devops.
About us :
- We provide professional services for Load Testing
- We’re strong contributors to JMeter and its eco-system
- UbikLoadPack is a set of Enterprise Grade plugins for Apache JMeter. Our solutions are used by Big players
- Get a Free trial
UbikLoadPack solution

![]()

Publication
![]()
