What is Prometheus ?
Prometheus is an open-source monitoring and alerting toolkit originally developed at SoundCloud. It is designed to monitor systems, services, and applications, and provides a time-series database, query language, and alerting capabilities.
Prometheus works by collecting metrics from different sources, such as HTTP endpoints, Linux system stats, and other exporters. It stores these metrics in a time-series database, which allows users to query and visualize the data using the Prometheus query language.
Connecting Prometheus to JMeter through the Observability Plugin
The UbikLoadPack Observability Plugin exposes the metrics of your performance test Live metrics in the OpenMetrics format. This allows interfacing it easily with OpenMetrics.
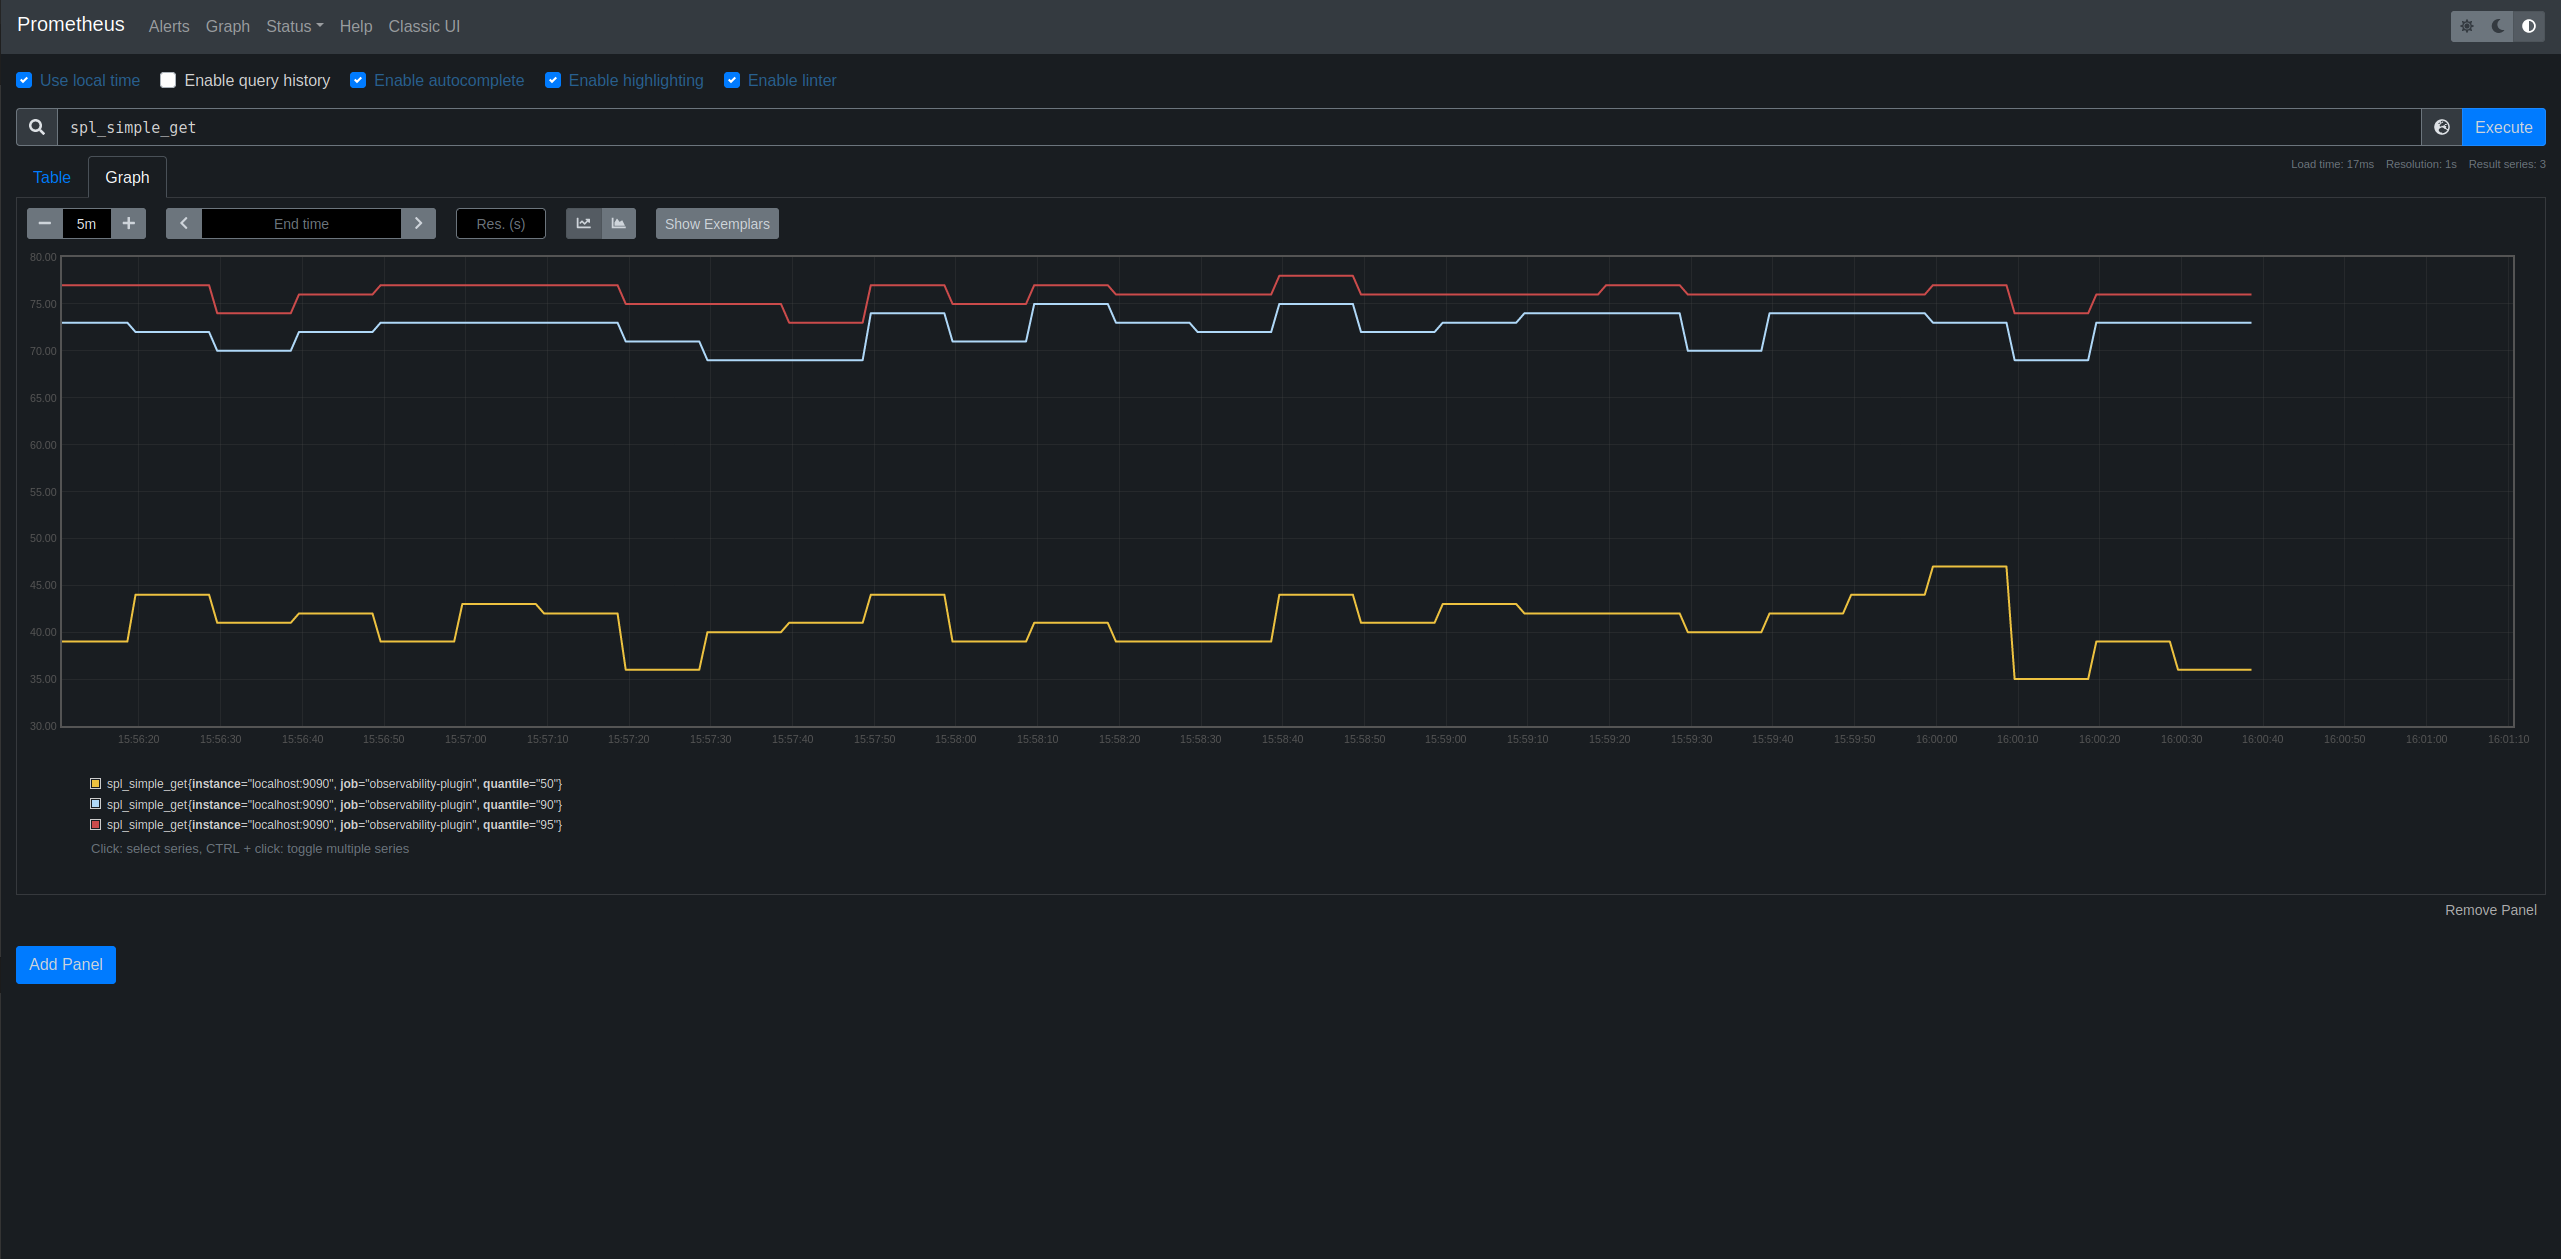
If you feel like you need more control on the graph displayed by the plugin, you can plug it to Prometheus. We are going to see how to do it in this article.
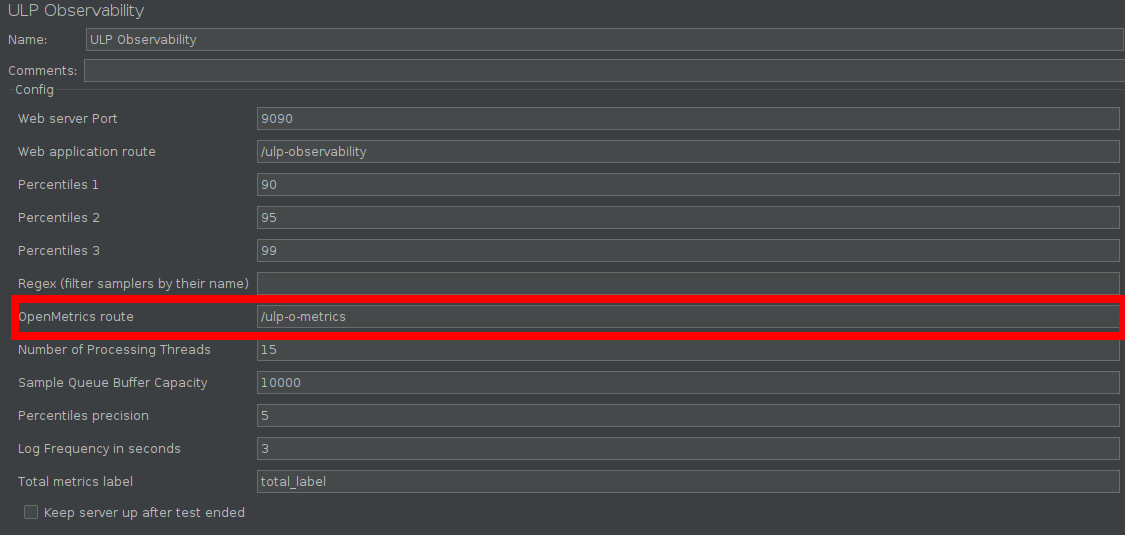
Prometheus needs to consume data at OpenMetrics format to work. This format is exposed by the plugin on the URL defined in this red rectangle :
With the above configuration, you can access the OpenMetrics datas from your test like this (when the test is running) :
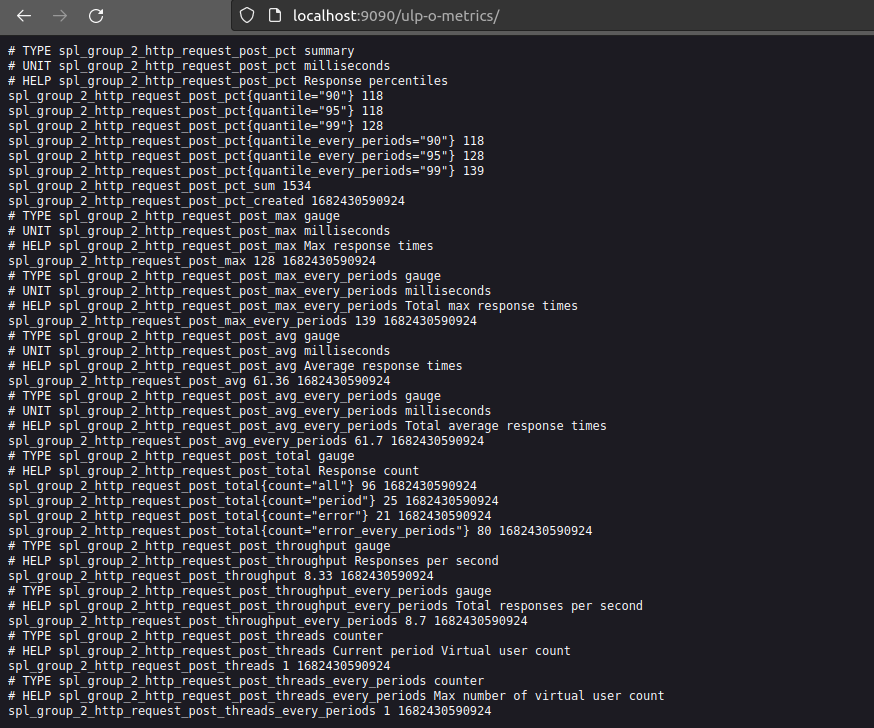
Here you can see a single sampler metrics for one period, and every periods. A period is the time in seconds defined in the ‘Log Frequency in seconds’ parameter. The data exposed on this URL are refreshed every periods. All we need to do now is connect Prometheus to our data flow.
Install Prometheus
If you haven’t installed Prometheus on your device yet,
Download the latest release of Prometheus for your platform, then extract it.
If you use Windows, add the extracted directory to the PATH env variable.
For Linux users, add it to the $PATH variable. Add it to the .bashrc file to make it permanent.
Prometheus configuration
Inside the directory of your JMeter test plan, add the following prometheus.yml file :
global:
  scrape_interval:     15s # By default, scrape targets every 15 seconds.

  # Attach these labels to any time series or alerts when communicating with
  # external systems (federation, remote storage, Alertmanager).
  external_labels:
    monitor: 'codelab-monitor'

# A scrape configuration containing Observability plugin endpoint to scrape:
scrape_configs:
  - job_name: 'observability-plugin'
    scrape_interval: 3s
    metrics_path: /ulp-o-metrics

    static_configs:
      - targets: ['localhost:9090']
Change ‘localhost:9090’ to match the host and port you are using to host the plugin. Also be careful to change the 3s scrape interval of the observability-plugin to match your ‘Log Frequency in seconds’.
Prometheus launch
Change your directory to the test plan directory, then enter this command to start using prometheus (on port 9095, change it with the one you prefer) :
prometheus --web.enable-admin-api --web.listen-address=:9095 --config.file=prometheus.yml
You can then access Prometheus from this url :
http://localhost:9095/graph
About UbikLoadPack:
- Ubik Load Pack is a set of Enterprise Grade plugins for Apache JMeter.
- We’re strong contributors to JMeter and its eco-system
- We provide professional services for Load Testing
- Free trial is available on https://ubikloadpack.com/tryout.p
UbikLoadPack solution

![]()
Publication
![]()