Context:
In our previous blog we showed how to easily create a Test Plan in JMeter using WebDriver sampler.
As WebDriver is very demanding in terms of CPU, using the Cloud is the best option we have to avoid maintaining a big infrastructure for only occasional load testing.
Using JMeter on AWS cloud is possible but requires a bit more work and maintenance. Using a SAAS is a good alternative if you don’t want to handle the configuration part of this work.
Why Redline13:
We chose in this blog Redline13 service for the following reasons:
- it’s the most competitive in terms of pricing and allows us to use our own AWS account to run the tests
- Configuration is pretty fast as we will see in this blog
- We had a great reactivity from Richard Friedman, the CTO, who very quickly answered all our questions and took into account what we reported in terms of enhancements to the service. We even saw some of those enhancements being implemented within few hours
- Integration with WebDriver is great, it’s just a matter of checking a box
- The service is growing very rapidly in terms of features
- We can use AWS Spot instances which also decreases the price of our tests, and Redline13 is smart enough to reuse under some circumstances the instance, so don’t kill it once you finish your test (I did the mistake 🙂 ) as you can reuse it if you start a test before Redline13 shuts it down
AWS Setup:
Connecting Redline13 to our AWS Account is explained here.
We just followed the documentation and nothing more.
With a free account, you have some limitations mentioned here.
As we wanted to access JMeter logs and results we purchased a Single User 1 Month plan.
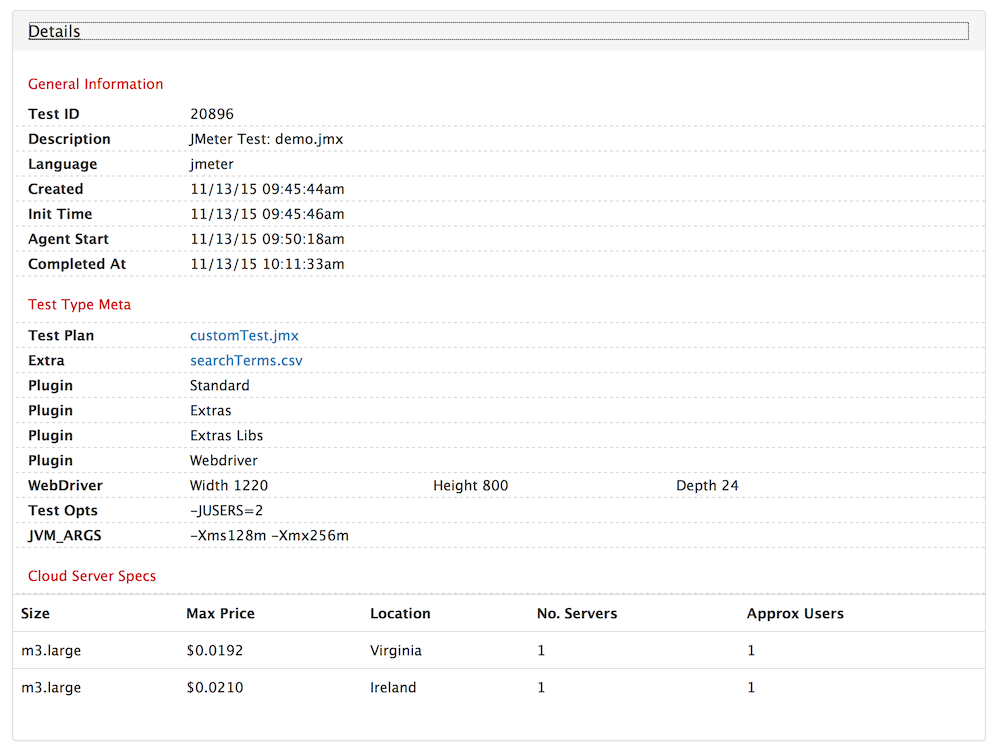
Test Configuration:
Test Plan configuration
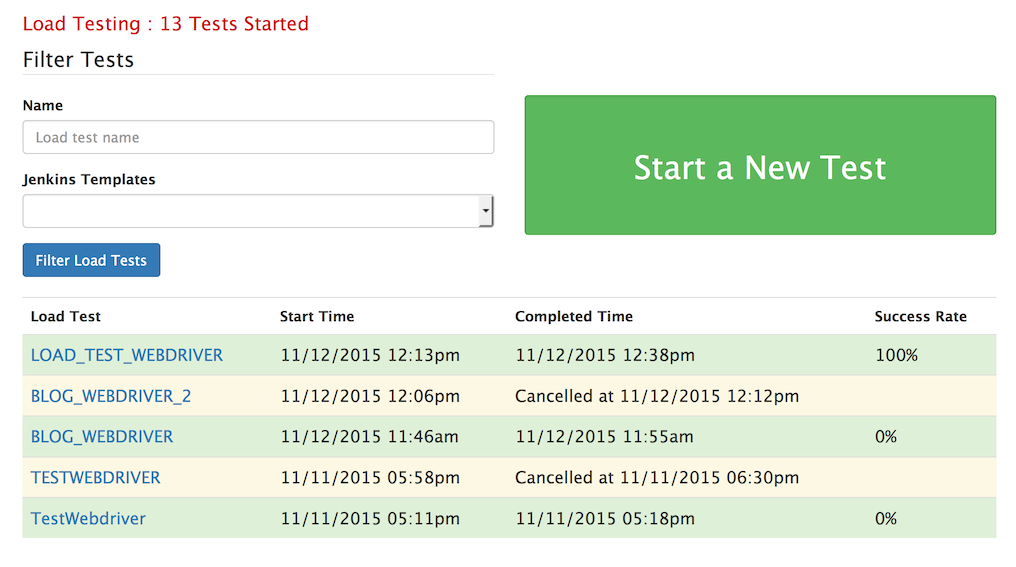
To start a test, just click “Start a New Test”:
Select the JMeter tab and upload your JMX file and CSV file(s). In our case we have a CSV file for the words we search in our Test Plan:
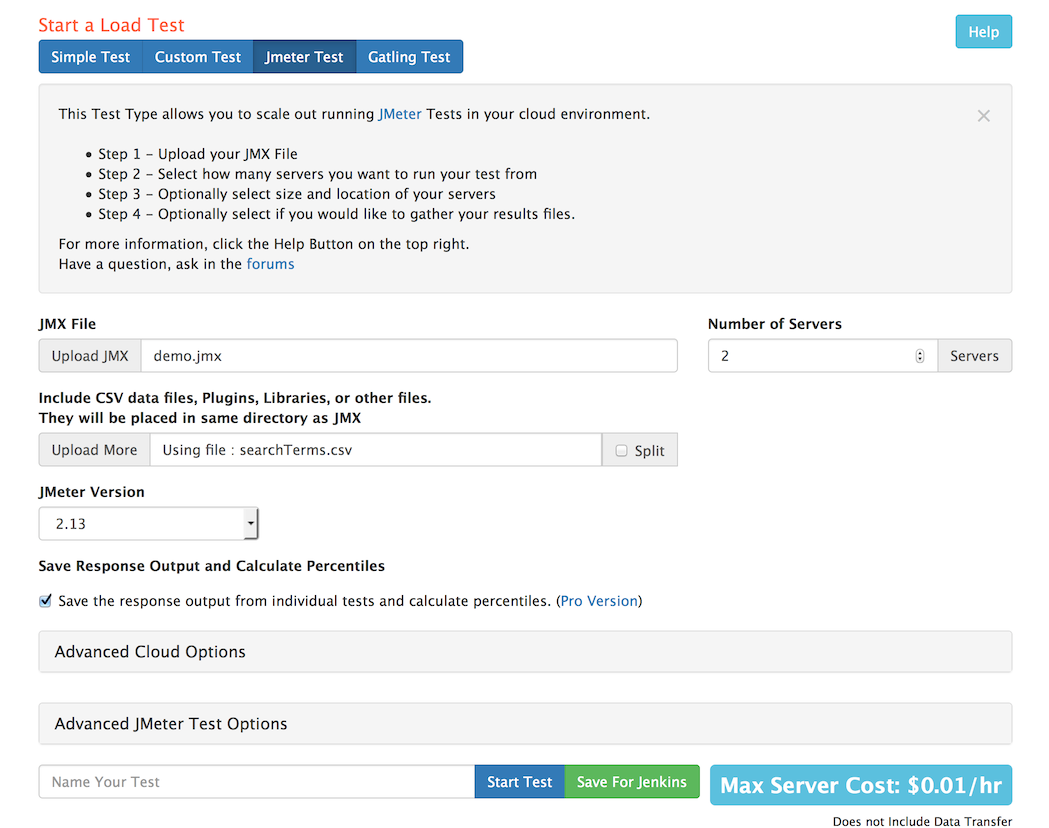
Note we select JMeter 2.13 as it is the only one supported for WebDriver tests, but it’s OK as it’s a best practice to always use the last JMeter version.
We also check “Save the response output from individual tests and calculate percentiles.” to have the percentiles and JMeter logs and CSV files.
Note that Redline13 uses a JAVA7 so ensure you don’t select Nashorn as Engine for Webdriver.
Advanced JMeter Test options
As we have made the number of threads configurable through:
${__P(USERS,1)}
We can pass the real value to our test through:
-JUSERS=2
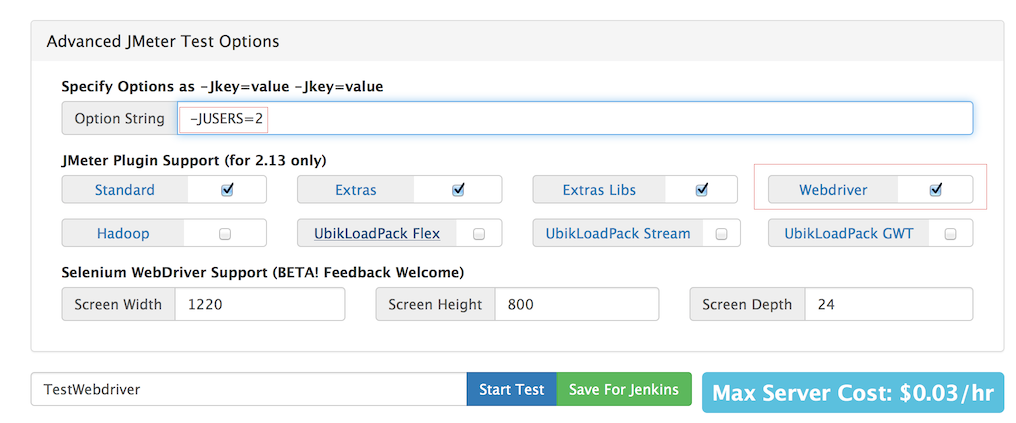
We also must check “Webdriver” option.
Advanced Cloud Options
This is the most interesting part.
It will allow us very easily to:
- Tag our instances for example to know the exact cost of a Load Test
- Distribute the test accross the world
- Use Spot Instances
- Select the type of instances we want and get an estimation of the price
As we will make a little test (for blog purpose 🙂 ) here, we will only use 2 servers but located in US and Europe.
We make the following configuration:
- We tag with CUSTOMER=DEMO
- We select 1 m3.medium server located in US-EAST-1 and put a bid a little higher than the Spot Instance price that the application shows
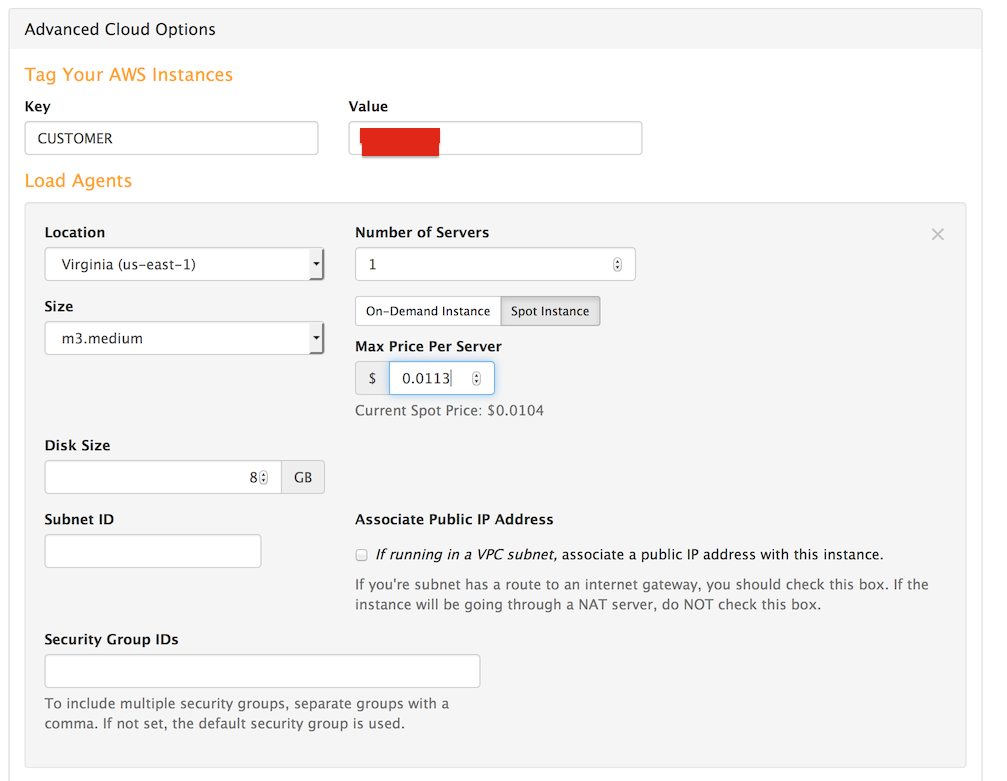
- We select 1 m3.medium server located in EU-WEST-1
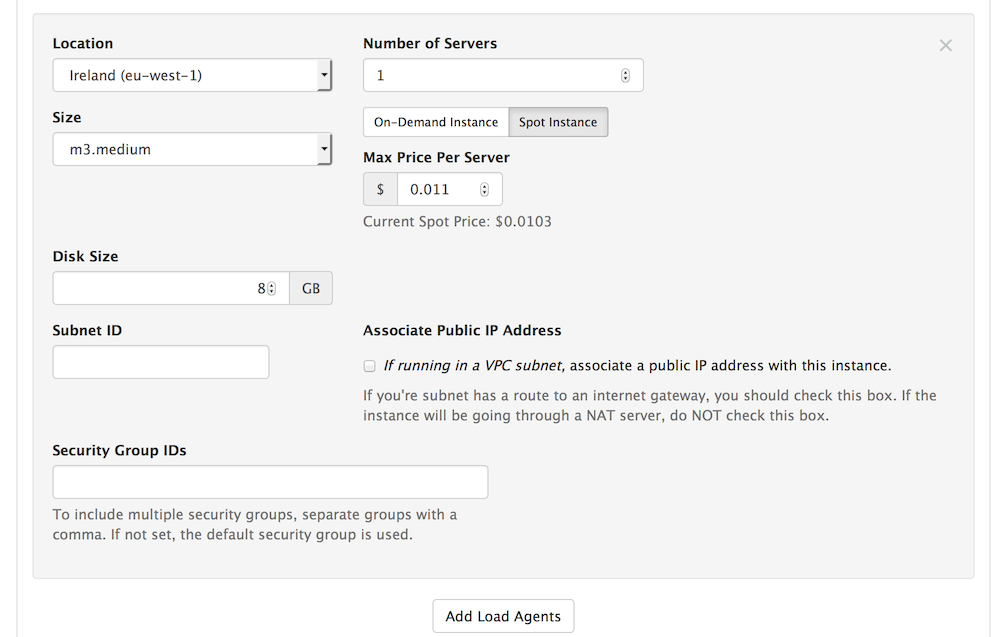
We can now start the test.
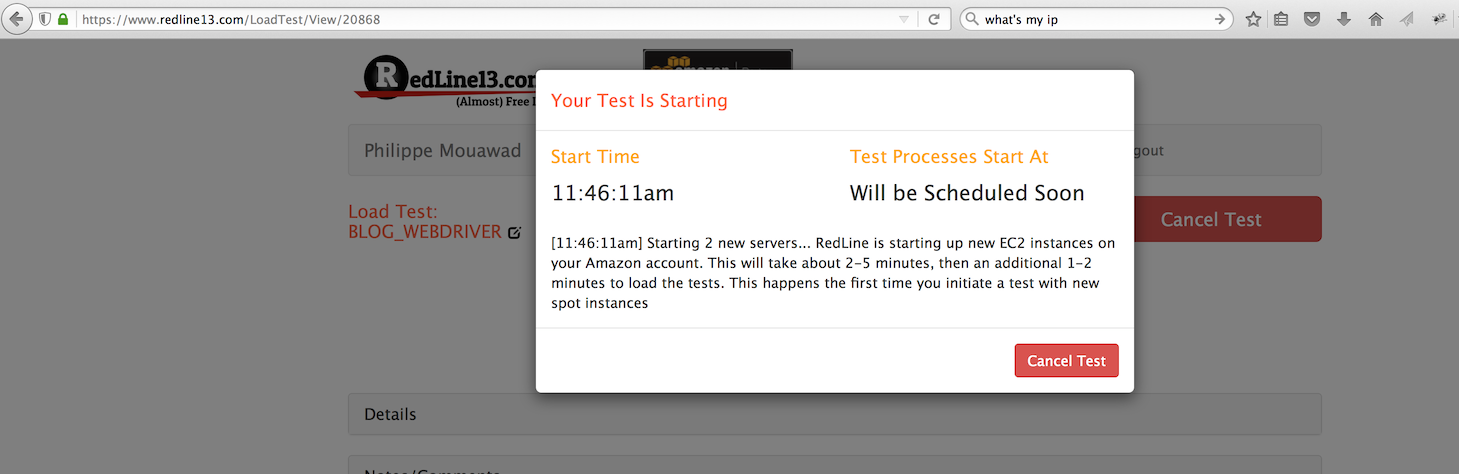
During the test
When we start the test a popup informs us of the progress:
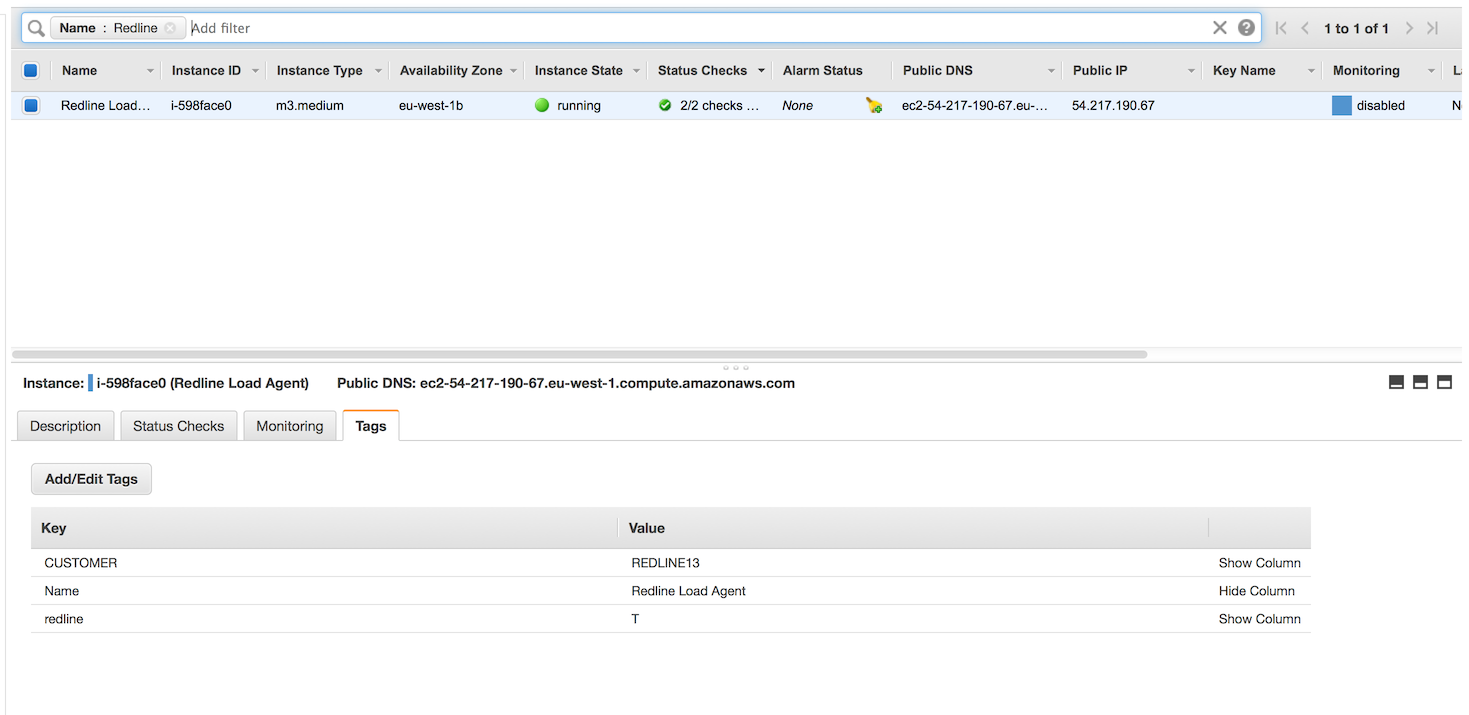
We go on our AWS Console in EC2 to see what’s happening:
The Ireland AWS region:
The Virginia AWS region:
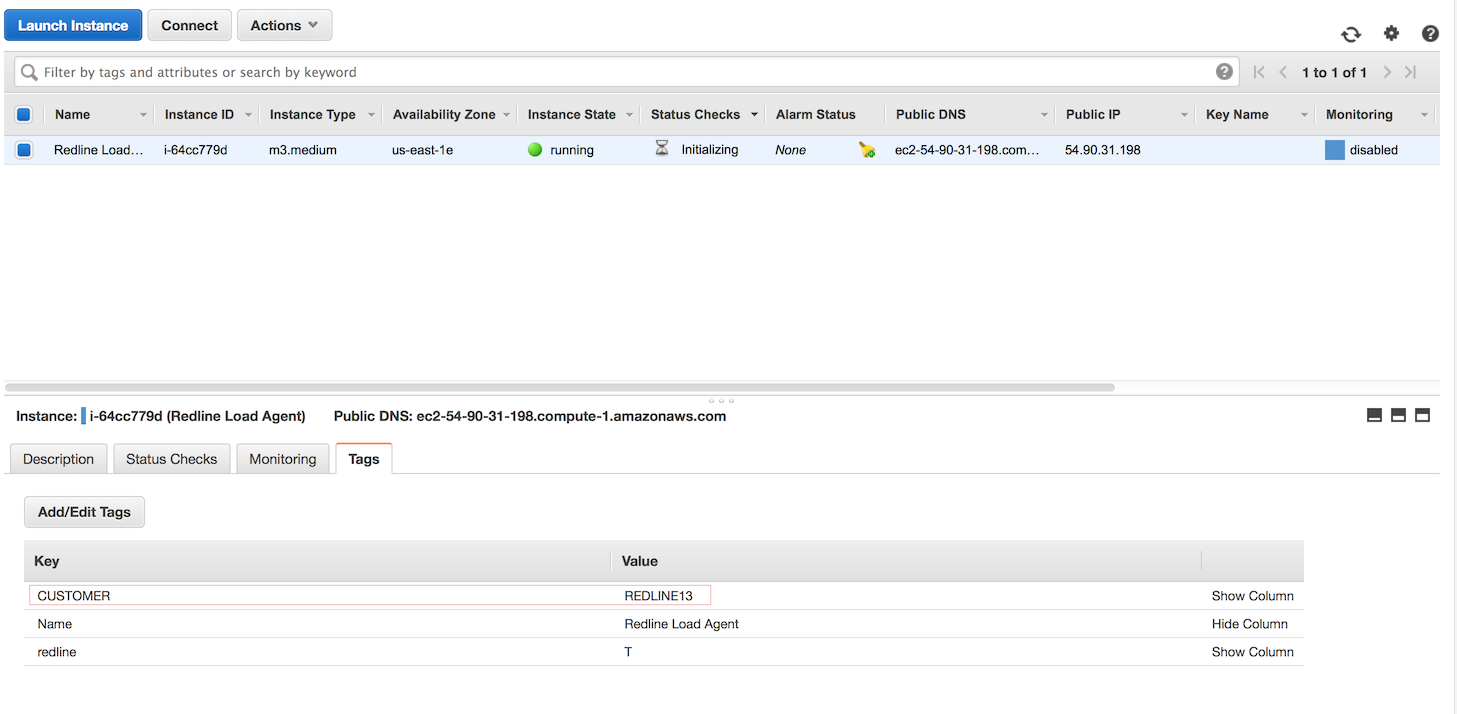
Once instances are ready, the test starts.
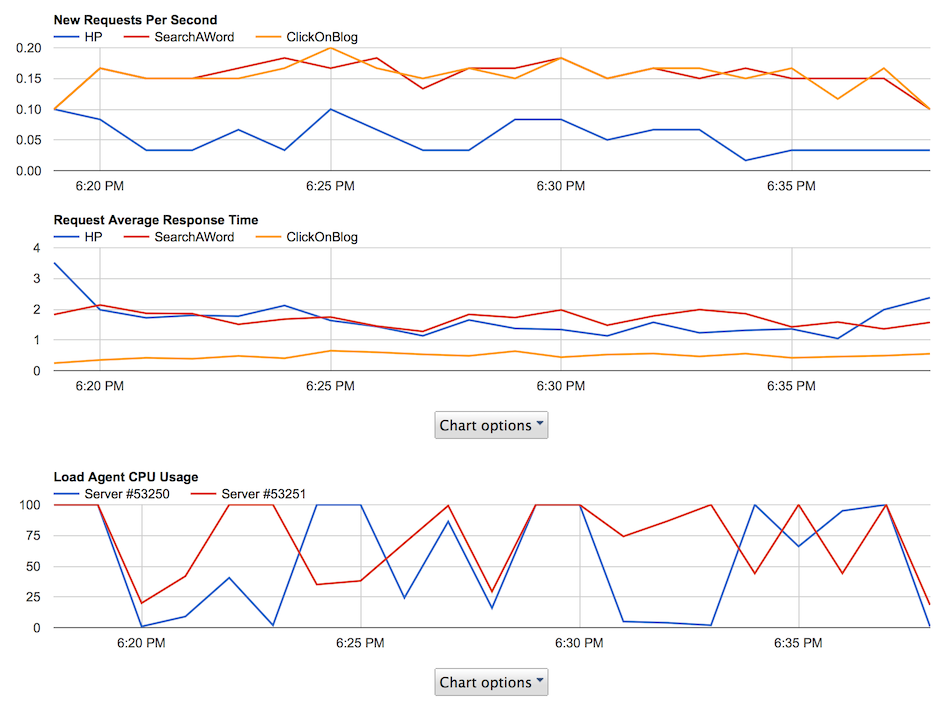
Redline13 reports:
- New requests per second
- Request Average Response Time to see if we are injecting the expected load
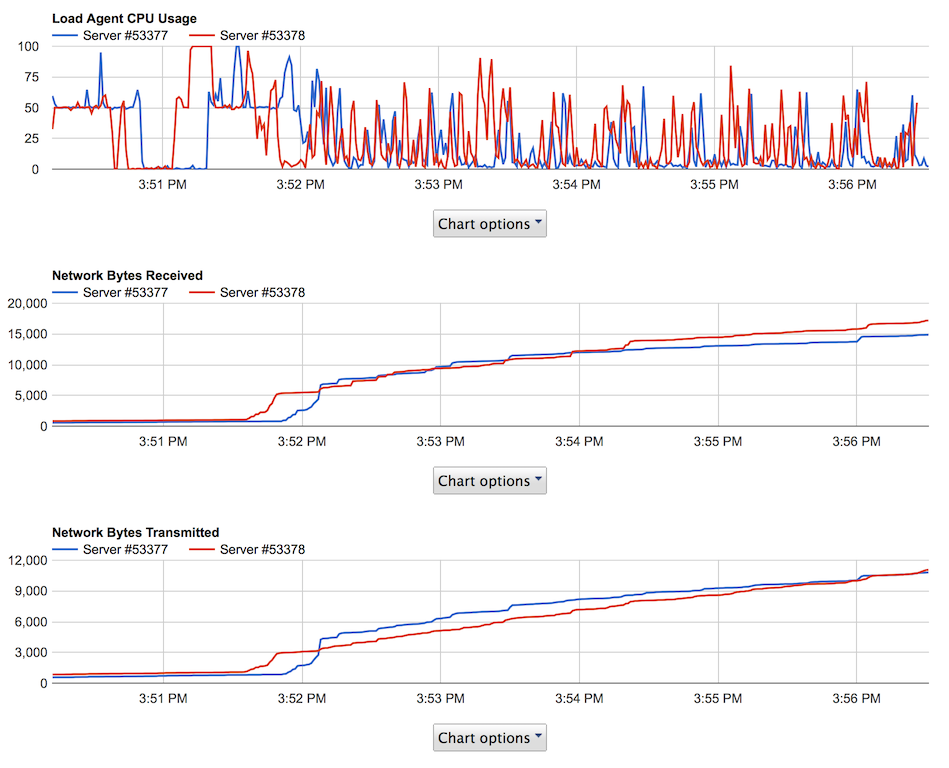
- Load Agent CPU Usage which is critical to check that our agents are not overloaded
- Network Bytes received
- Network Bytes Transmitted
We see in the below screenshot that our Load Agent reaches 100% CPU many times, this will make it hard to analyze the results as we cannot ensure that it is injecting the right load, you can conclude here that an m3.medium (which has only 1 vCPU)is too short for 2 Users (CPU being taken by Firefox instance). So in real world test, you would need to upgrade to an m3.large for example:
So I started another test using m3.large instances and got better Load Agent behaviour:
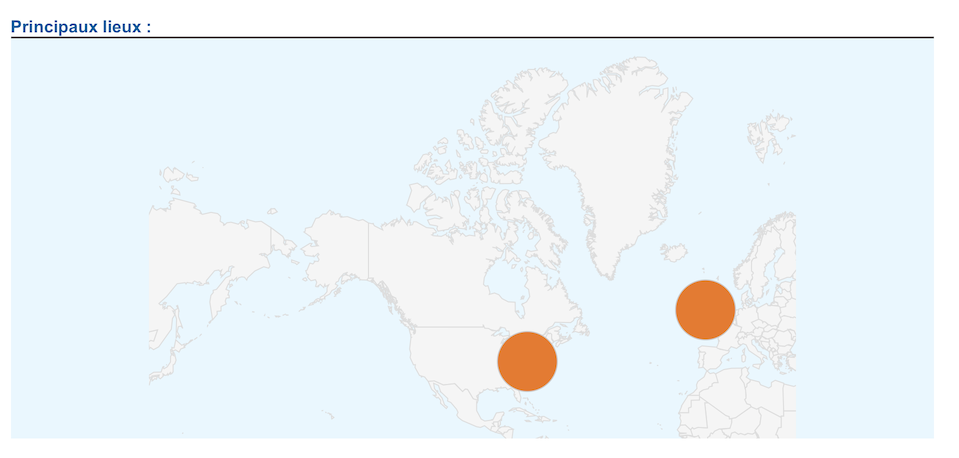
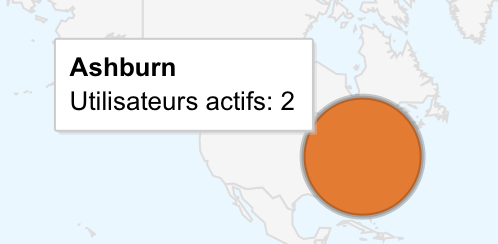
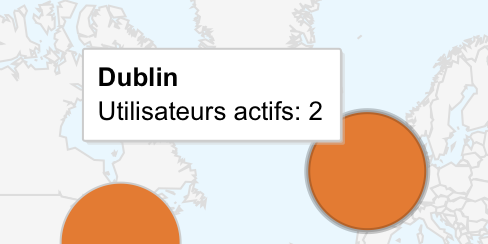
We also check on our Google Analytics that the number of Users matches expected load, this is a benefit from using Selenium Webdriver compared to JMeter raw tests, as the simulated users are real browsers they execute the Google Analytics scripts:
We have 4 visitors:
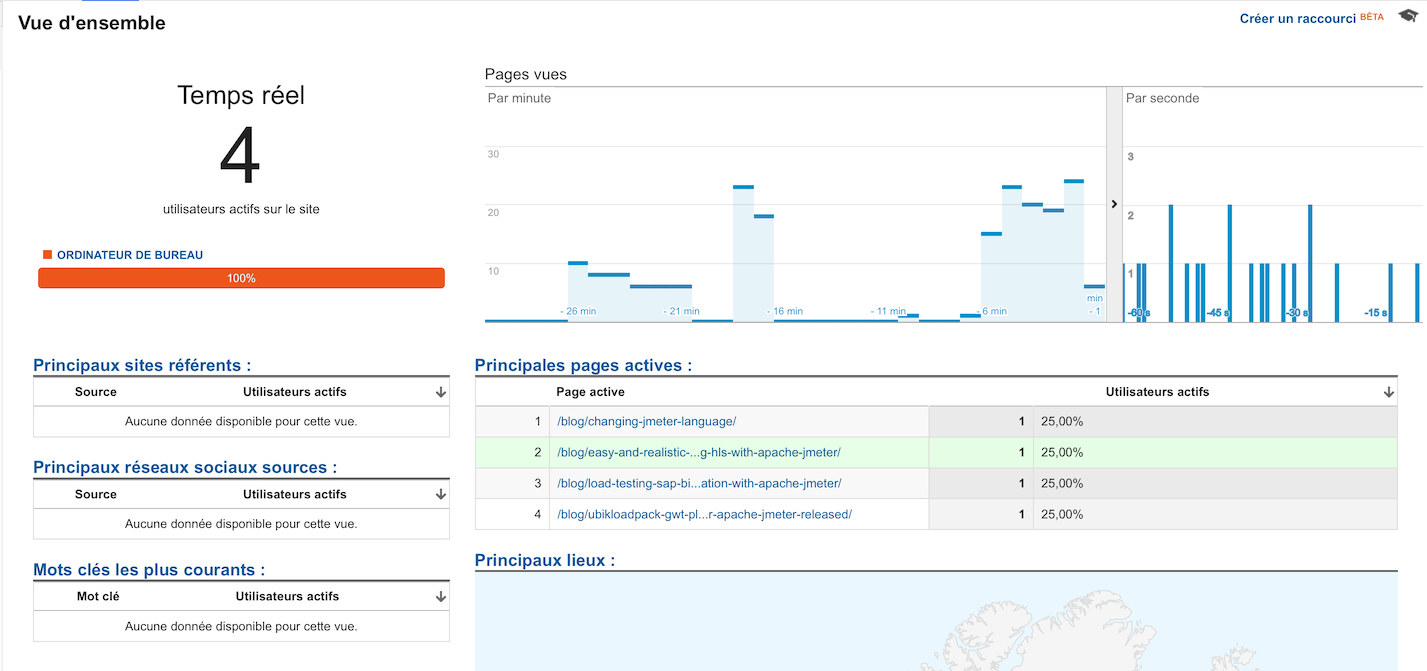
Located in Virginia and Ireland:
End of test
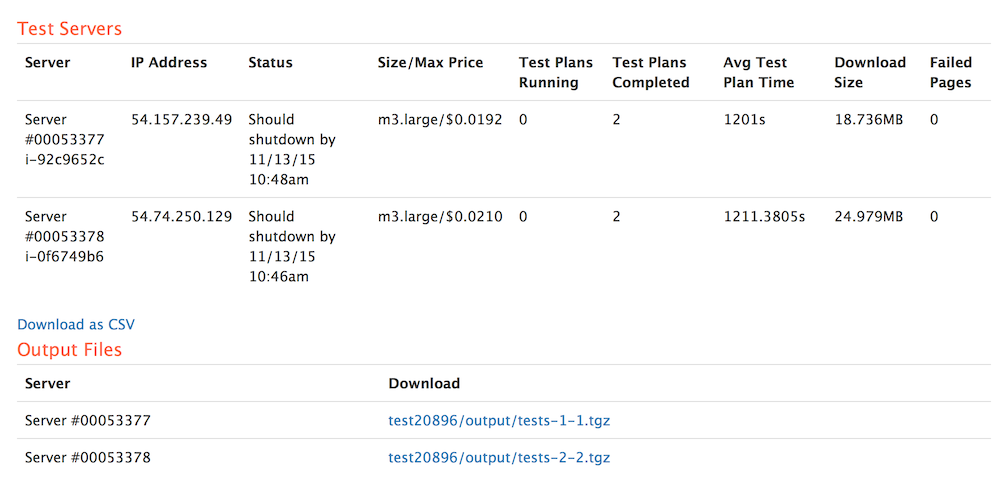
At the end of the test, Redline13 computes some metrics like percentiles and makes the logs and result files available for download:
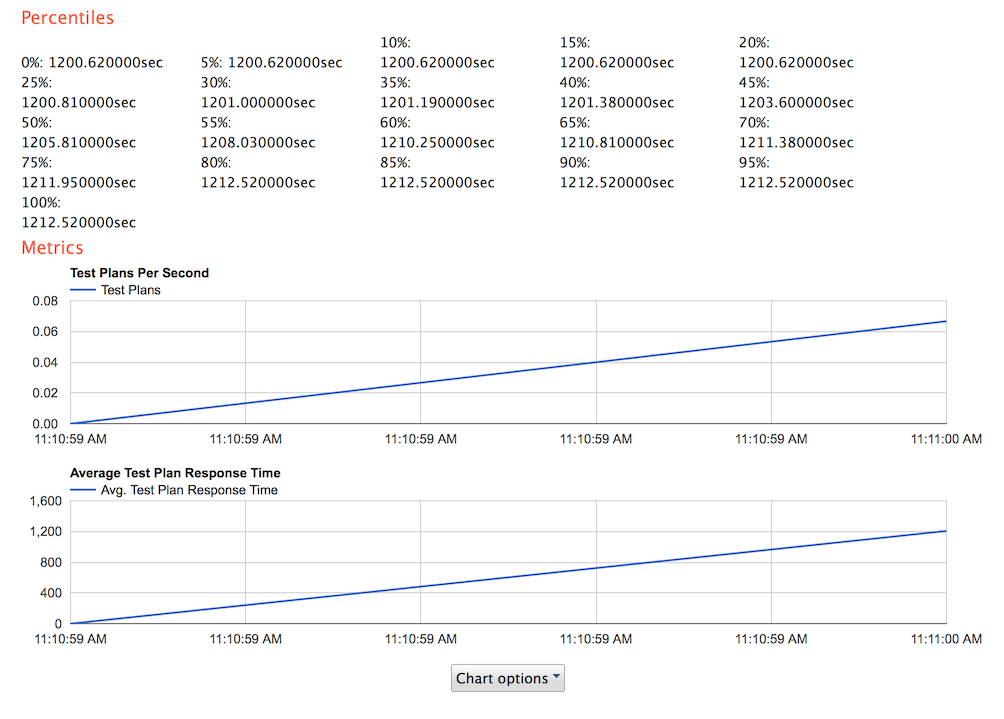
And a detailed report on the test:
We can also download the CSV of the results.
For now the reporting on Redline13 is limited but as per Richard words, it will be enhanced.
Anyway with JMeter rich eco-system you can generate pretty nice graphs using JMeter-Plugins as we already explained it in a previous blog or use this feature to generate a nice report which contains a wealth of information (Dynamic graphs, APDEX, Summary results…). This feature will hopefully if accepted be in the next JMeter version.
Once finished you can save your test for a potential automation with Jenkins, clone it to replay it a bit differently.
ND;LR:
To summarize you can see in this blog how easy it was to setup and run a JMeter Load Test from the Cloud using Redline13.
In few minutes the test is ready to run and cost us $0.0553 (+ a suscription to Redline13 of 30$ for 1 month)for a 1 hour run. Of course if we increase the number of users we need it will cost us a bit more but you can guess that it’s pretty reasonable compared to renting or managing our own infrastructure.
We also gain a Jenkins integration and a historization of our results.
About author:
Philippe Mouawad works as an Architect and technical expert for Ubik-Ingenierie where he leads among other things the development of UbikLoadPack a set of Commercial Plugins for Apache JMeter allowing to load test different protocols like HLS, GWT, Flex.
Philippe is a committer on the Apache JMeter project and member of the PMC since October 2011.
Finally he is a co-author of a french book on JMeter called Maîriser JMeter: Du test de charge à Devops.
About us:
- Ubik Load Pack is a JMeter based solution for complex protocols.
- Follow us on Twitter and StackOverflow.
- Follow Apache JMeter on Twitter
UbikLoadPack solution

![]()
Publication
![]()