JMeter New GUI features to increase your productivity
From UbikWiki
Contents |
JMeter New GUI features to increase your productivity
Introduction
JMeter GUI has been improved in many ways in the last four versions and work continues as of upcoming 2.9 version.
Enhancements have been made to make its ergonomy better and increase user productivity and pleasure.
With Apache JMeter 2.6 came a new Toolbar that speeds up access to most useful commands used in JMeter and made its look And Feel a bit more up to date.
It also came with 3 very useful features:
Start with no pause
This feature is particularly useful during script debugging.
Indeed once you have put timers in your script that can last from 5 to 60 seconds or more, debugging the script can take you a lot of time if you have to wait for the 10th sampler to fix or validate its regexp.
This feature runs the script ignoring all Timers pauses.
It is also very useful during Test Data validation, you can then launch a reduced number of threads and validate test data much faster than you used to do it before.
Let’s see the difference:
Regular Start:
You get this in View Results in Table:
Notice Login Sampler starts 15s after HP sampler has ended.
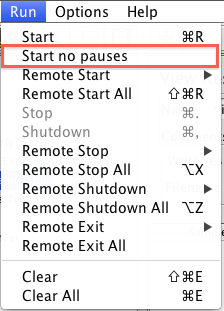
Now let’s use Start No Pause, you can use doe this:
- Using Icon:
- Using Menu:
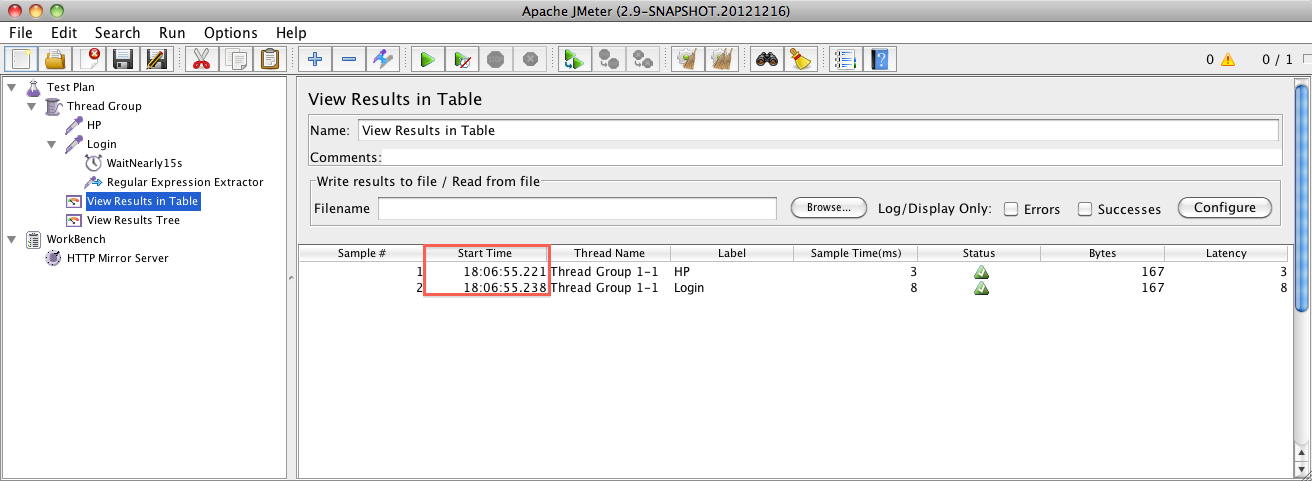
You get this in View Results in Table:
Notice Login Sampler starts immediately after HP sampler has ended.
Thank’s to this feature, you’ve spared 15 seconds of scripting time. Multiply this with the number of times you run a Test during debug phase and you see how much time you can gain.
Find Feature
Version 2.6 came with another precious feature which enables searching for full text or regexp inside your script.
Although it was always possible to search for a text by opening the JMX file in an editor, doing that from JMeter GUI make it more useful as you can modify the search results.
With version 2.9, this feature has been improved to unfold tree nodes that match the search and increase search scope as feature now searches in all Test elements properties.
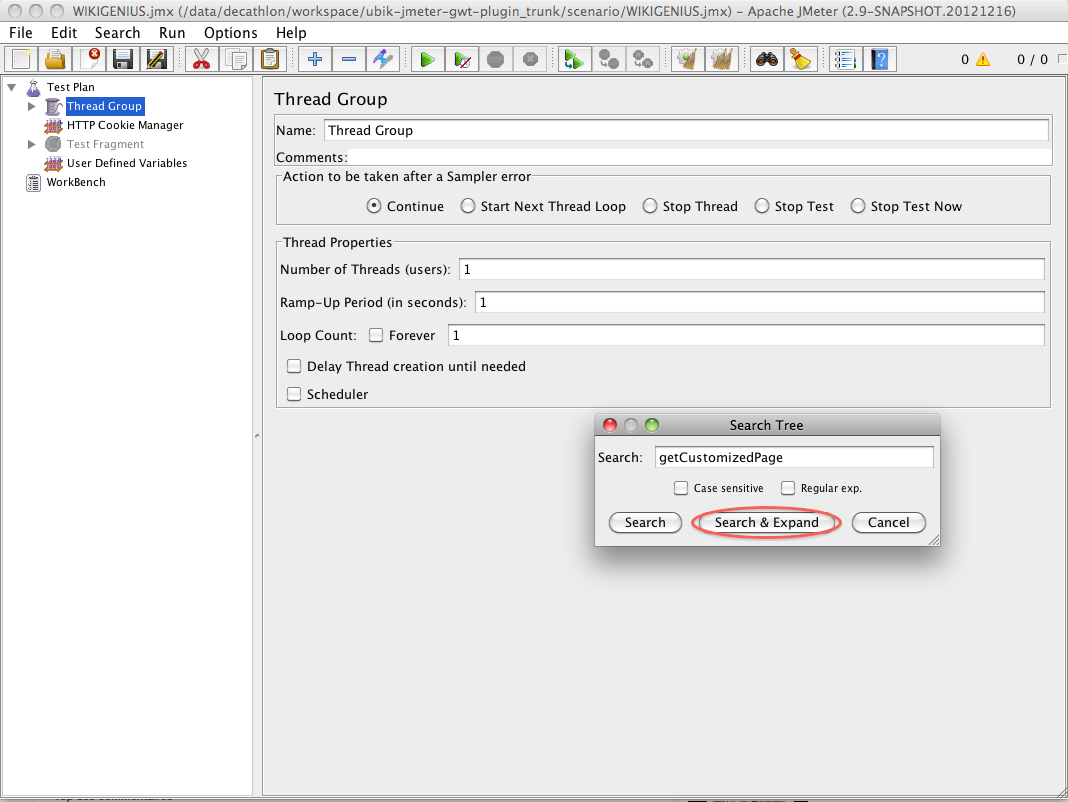
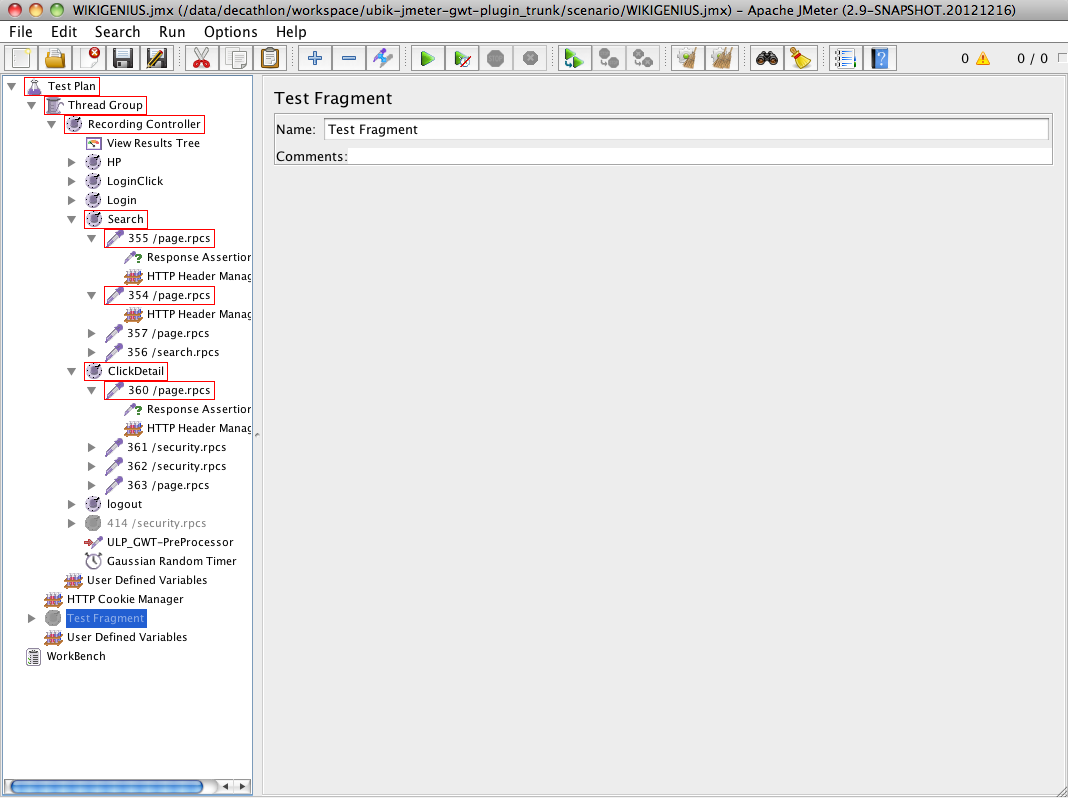
Let's search for some text and see what happens:
Notice how JMeter 2.9 automatically expands the tree to nodes to better show results.
I often use this feature to:
- find and remove from my script all data related to environment and variabilize it
- find any dynamic value which would have been recorded by Proxy (remaining jsessionid encoded in URL, host in HeaderManager...)
Log Viewer
This panel receives all log events once unfolded.
This enables viewing logs from within JMeter GUI.
No need to open an external file anymore.
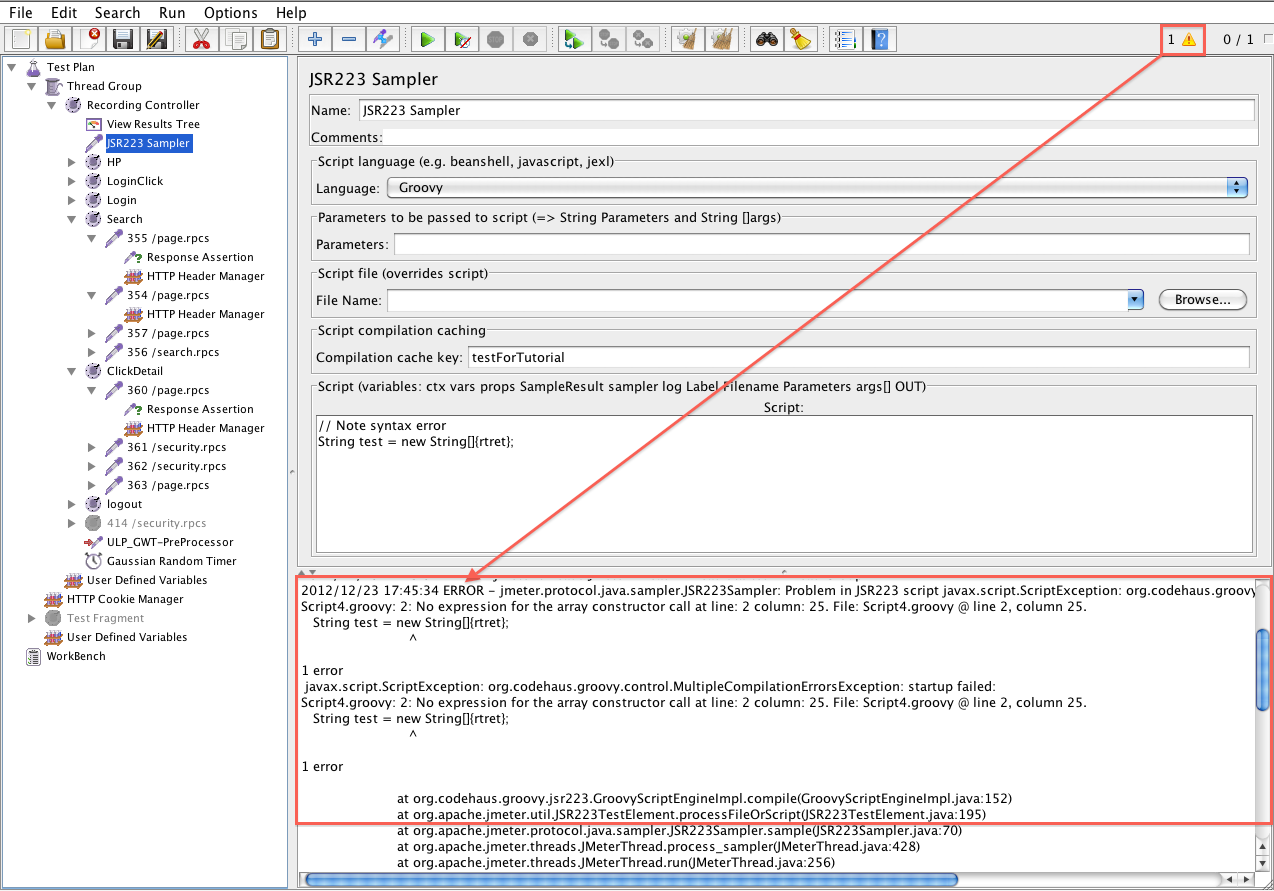
Look at top right part of JMeter GUI, you will see a warning icon with a number on its right.
This number is updated with log errors. Clicking on it unfolds the panel but you need to replay your script to see events.
Let's see an example:
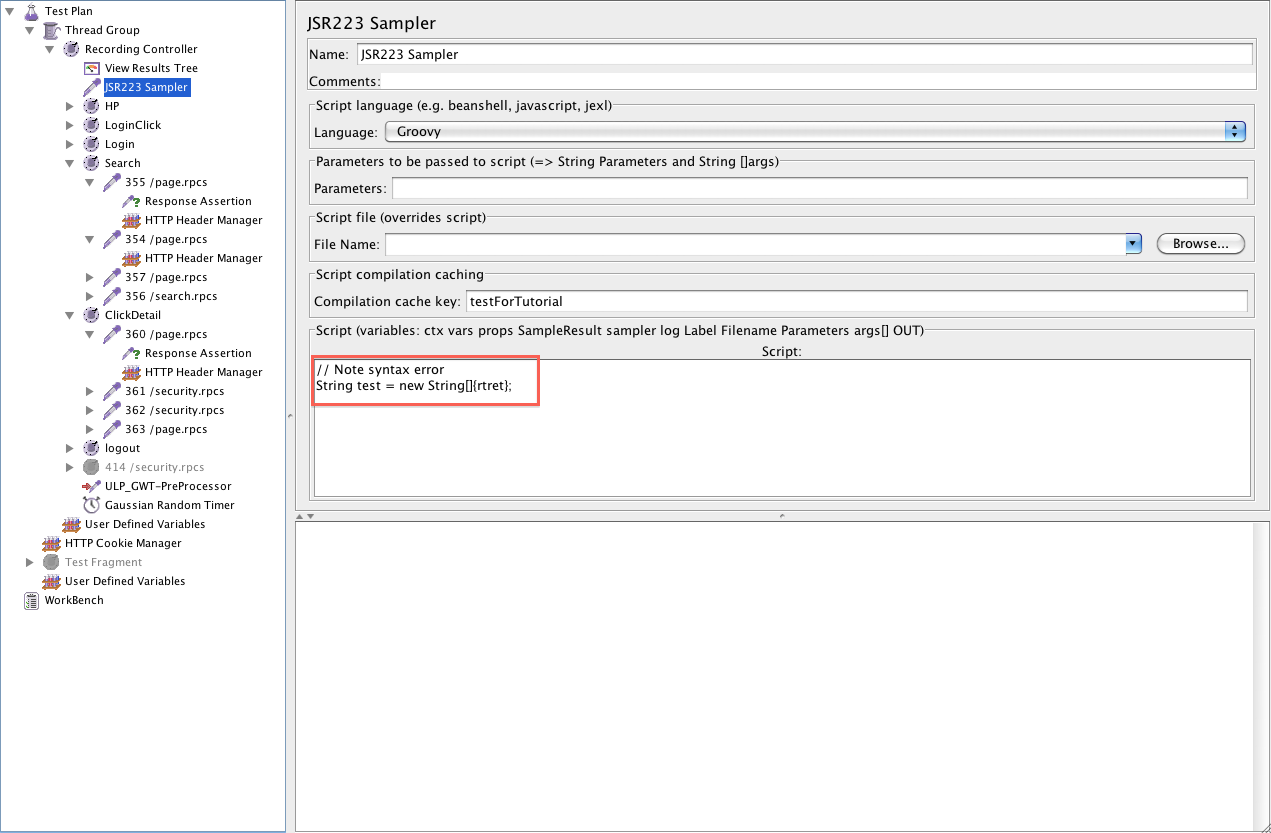
I create a JSR 223 sampler that contains some groovy code with syntax error:
I run script, see how Error is displayed:

